Stanislav Levchenko
September 8, 2023 ・ Kubernetes
DDoS attack on k8s hosted application
DDoS Attack Detection And Mitigation Using Calico & Falco In K8s Environment
Introduction
New technologies give rise to new attack vectors. In the Kubernetes environment, we should think about how to prevent privilege escalation from containers to k8s nodes, and how to restrict unauthorized connections to kubeAPI. About users' permissions using RBAC and isolating different parts of infrastructure by network policies. And about many mode security related things. But the old-school methods of influencing applications haven’t gone anywhere. One of them is a DDoS attack.
On one hand, cloud-hosted infrastructures are usually much more sustainable to such kinds of attacks. Especially if you are not a very huge project. Cloud providers take responsibility for network infrastructure including DDoS protection, so usually you shouldn’t be wary about DDoS attacks on layer 3/4. And also they give quite a broad internet channel, and usually, you can easily withstand traffic spikes.
Attack example
But can you feel safe hosting your application in Kubernetes in some cloud? Let’s take a look at one simple example. Imagine that you have some application that is deployed in K8s. You are smart and want your app to be flexible and react to load fluctuations. So, you have set horizontal autoscaler for your pods, based on the resource your application is the most hungry for. Your could provider also offers you node autoscaler. If your nodes can’t host all the needed resources, your cluster will be scaled automatically. Everything looks fine, flexible, and fail-safe. And, most importantly, everything works.
And one time you discover quite strange trends in your dashboards. You get explosive growth of requests. Your scaling system works well and the number of pods and after that the number of nodes increases. After a short peak requests disappear and it takes several minutes for your system to scale down. In a few minutes, the situation repeats, and the number of instances grows again. Again and again.
Meet the Yo-Yo attack: your app is working, and can handle all the traffic. So what is the purpose of this Yo-Yo technique? The main target is not your application, but your wallet. This means that you have to pay for nothing, literally. This fake traffic makes your infrastructure create new instances which do nothing but you still have to pay for them.
Let’s try to define if it is possible to detect and prevent such kind of attack using standard k8s tools.
Detection with Calico
In this article, we will use Calico and Falco for our purposes. Calico is an eBPF-based CNI plugin. It has access to all network-related logs (Layers 3 and 5), application layer logs (Layer 7), and DNS logs for all network traffic in the cluster. So, it is a great tool to observe all network activity. You may send logs from Calico to your logs storage system (Elasticsearch or something else) or use the Calico Enterprise tool. Despite the used tool, the main goal is to create a model of normal traffic behavior. If you are using just the open source Calico CNI plugin, you probably will need to dig into logs and Prometheus metrics to do it. You should define the normal level of inbound traffic, the number of requests to your app, the number of DNS requests, etc. Don’t forget to keep in mind normal fluctuations depend on the time of the day or the day of the week. Maybe the season or some irregular event causes the traffic to increase. After you define normal behavior, you can set alerts if the values of metrics are out of the threshold. If you use such a tool as Calico Enterprise, this task is much easier. You have quite a usable web UI and have built-in detectors like http_connection_spike, generic_dns, generic_l7, inbound service bytes bytes_in, and some others. And you will have alert notifications about abnormal events. It may look like this:
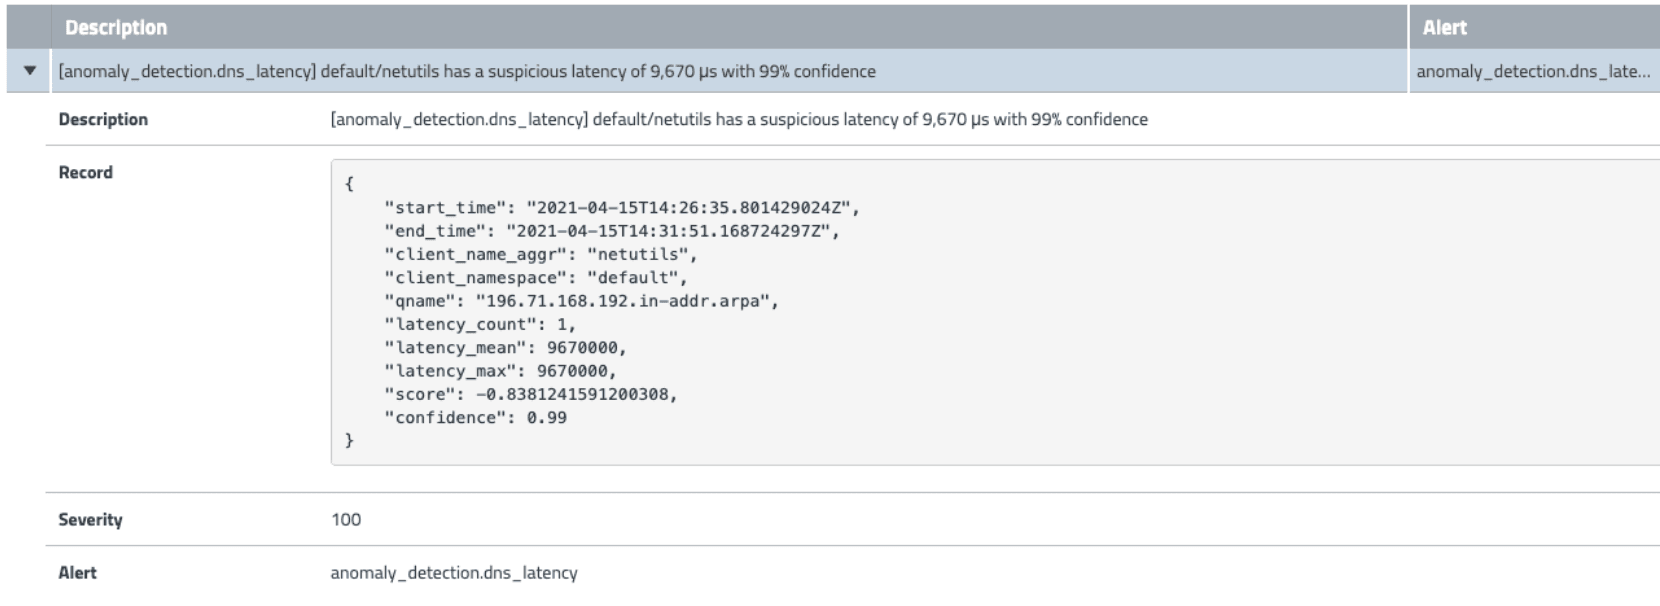
As far as this article is not any kind of promo for Calico enterprise, we will just mention it, but won’t deep dive into the details of this tool. The main point we want to convey is that Calico as the CNI plugin covers all necessary layers of your k8s infrastructure to detect any kind of abnormal network behavior. You may use any kind of aggregation or analytics tools to make conclusions.
Detection with Falco
Another cool thing for monitoring and alerting you about security risks in your cluster is Falco. Falco is an open source tool for real-time logging and invasion detection. We have briefly observed it in our article about Enhancing Runtime Security and Policy Enforcement. Let's take a look at it a bit closer. We mentioned that Falco taps into the Linux kernel and keeps a watchful eye on all system calls, and the low-level invocations used by applications to request action from the kernel. But to make Falco analyze requests to Kube API server, we need to combine them somehow. If you deploy Falco as DaemonSet in your Kubernetes cluster (and this is the most reasonable way, because you won’t need to install it manually on every node) using helm chart, falco-k8saudit-webhook service will be deployed in the target namespace. It is an endpoint that can receive logs from Kubernetes. One important remark. By default in values.yaml file of Falco helm repository web hook-service set as NodePort. Probably you don’t want to expose your node to the outside world without real reason, so, don’t forget to change values in the service section. It can look like this
services:
- name: k8saudit-webhook
type: ClusterIP
ports:
- port: 9765 # See plugin open_params
protocol: TCP
After that, you should make your KubeAPI server send logs to the Falco webhook. First of all, create a directory /etc/kubernetes/audit/ and put there the manifest of the Policy object. You may read much more details in the official documentation. Here is a simple example of policy:
apiVersion: audit.k8s.io/v1
kind: Policy
rules:
- level: Metadata
resources:
- group: ""
resources: ["pods", "services", "configmaps", "endpoints", "persistentvolumeclaims", "persistentvolumes", "nodes", "events", "secrets", "serviceaccounts", "replicationcontrollers"]
users: ["*"]
verbs: ["create", "update", "patch", "delete"]
omitStages:
- "RequestReceived"
- level: Request
resources:
- group: ""
resources: ["pods", "services", "configmaps", "endpoints", "persistentvolumeclaims", "persistentvolumes", "nodes", "events", "secrets", "serviceaccounts", "replicationcontrollers"]
users: ["*"]
verbs: ["create", "update", "patch", "delete"]
omitStages:
- «RequestReceived"
Briefly, in this manifest, we define resources, users, actions, and the level of logging that will be audited. The second step is to create a webhook.yaml file in the same audit directory. It will configure how the kube API server will forward its log messages. Here is an example of this config
kind: Config
clusters:
- name: falco
cluster:
server: http://10.105.127.224:9765/k8s-audit #replace ip
contexts:
- context:
cluster: falco
user: ""
name: default-context
current-context: default-context
preferences: {}
users: []
Make sure you use the right IP address for your falco-webhook service. You can get it by
~% kubectl get services -n falco
NAME TYPE CLUSTER-IP EXTERNAL-IP PORT(S) AGE
falco-k8saudit-webhook ClusterIP 10.105.127.224 <none> 9765/TCP 7d2h
After these files are in their place we need to let the Kube API server know that it must audit defined events. For this, we will edit the kube-apiserver manifest. Put these arguments for the kube-apiserver command:
- --audit-policy-file=/etc/kubernetes/audit/policy.yaml
- --audit-webhook-config-file=/etc/kubernetes/audit/webhook.yaml
- --audit-log-format=json
And mount created files to the apiserver container. Add to volumeMounts and volumes sections:
volumeMounts:
- mountPath: /etc/kubernetes/audit
name: audit
volumes:
- hostPath:
path: /etc/kubernetes/audit
type: DirectoryOrCreate
name: audit
If everything went smoothly you will see messages in Falco pods logs:
05:01:19.454933143: Warning Mount was executed inside a privileged container (user=root user_loginuid=-1 command=mount -t ext4 -o defaults /dev/longhorn/pvc-5f5dfb9f-87b2-45fb-8264-7bfce0c1c3b4 /var/lib/kubelet/plugins/kubernetes.io/csi/driver.longhorn.io/28bdadce0d3ffc0010ce3f044bab2d43be90d1bbb02f70eca99d6e252f84f83d/globalmount pid=832613 k8s.ns=longhorn-system k8s.pod=longhorn-csi-plugin-5hvbt container=63805f1311a5 image=docker.io/longhornio/longhorn-manager:v1.4.2 exe_flags=EXE_WRITABLE)
05:01:19.734493292: Warning Mount was executed inside a privileged container (user=root user_loginuid=-1 command=mount -o bind /var/lib/kubelet/plugins/kubernetes.io/csi/driver.longhorn.io/28bdadce0d3ffc0010ce3f044bab2d43be90d1bbb02f70eca99d6e252f84f83d/globalmount /var/lib/kubelet/pods/386f1fda-eb8f-49b0-bf1b-80e2c91fed8f/volumes/kubernetes.io~csi/pvc-5f5dfb9f-87b2-45fb-8264-7bfce0c1c3b4/mount pid=832622 k8s.ns=longhorn-system k8s.pod=longhorn-csi-plugin-5hvbt container=63805f1311a5 image=docker.io/longhornio/longhorn-manager:v1.4.2 exe_flags=EXE_WRITABLE)
05:01:19.746597366: Warning Mount was executed inside a privileged container (user=root user_loginuid=-1 command=mount -o bind,remount /var/lib/kubelet/plugins/kubernetes.io/csi/driver.longhorn.io/28bdadce0d3ffc0010ce3f044bab2d43be90d1bbb02f70eca99d6e252f84f83d/globalmount /var/lib/kubelet/pods/386f1fda-eb8f-49b0-bf1b-80e2c91fed8f/volumes/kubernetes.io~csi/pvc-5f5dfb9f-87b2-45fb-8264-7bfce0c1c3b4/mount pid=832623 k8s.ns=longhorn-system k8s.pod=longhorn-csi-plugin-5hvbt container=63805f1311a5 image=docker.io/longhornio/longhorn-manager:v1.4.2 exe_flags=EXE_WRITABLE)
Falco comes with a bunch of default rules. But also, you can define your own custom rule. These rules are defined in a separate file and can be used during deploying Falco. Custom custom rules files can look like this:
customRules:
custom_k8s_rules.yaml: |-
- list: "tor_ipv4_entry_nodes"
items:
- "195.201.9.37"
- "95.216.198.252"
- "185.165.190.167"
- "185.87.50.180"
- "95.153.32.22"
append: false
- rule: "Connection to TOR IPv4 Network Entry Node (egress)"
desc: "Connections detected in pod or host. The rule was triggered by addresses known to be TOR Nodes"
condition: "evt.type = connect and evt.dir = < and fd.rip in (tor_ipv4_entry_nodes)"
output: "Detected connection to known TOR Node from pod or host. %proc.cmdline %evt.args"
priority: "warning"
tags:
- "network"
source: "syscall"
append: false
Use this file during upgrading the Falco helm chart helm
helm upgrade --install falco falcosecurity/falco --namespace falco -f ./values-syscall-k8saudit.yaml -f ./custom_k8s_rules.yaml --create-namespace
One more advantage of Falco is that it can send notifications to different channels like email or Slack. Read about how to take full advantage of it in Falco's official documentation.
Great, we have installed Falco. But how can we use it for DDoS detection? Usually, the attacker wants to hide himself during DDoS. One of the most common ways to do it is to cover traffic to the TOR network. It allows to anonymize of the connection and makes it quite difficult to trace the start point of the traffic. From time to time host, which covers its traffic to TOR, changes its IP address, and this makes the task of detecting DDoS harder.
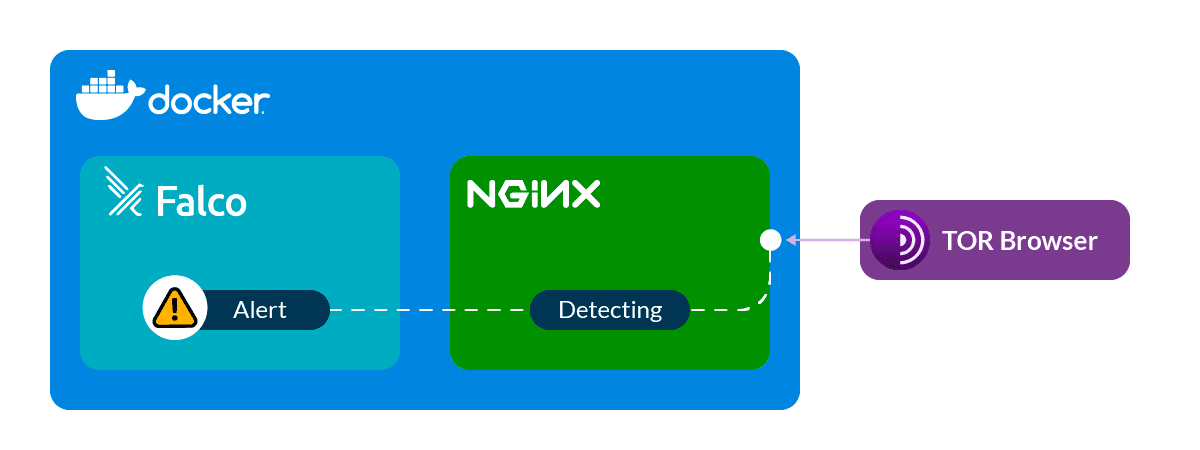
However different organizations collect and update lists of IP addresses, which are used in the TOR network. And we can use them in our custom rules for Falco. We can make them manually but there is a much better way. Here is a pretty good script that can generate Falco rules to detect incoming traffic from TOR networks. Even more. It generates rules to detect outgoing traffic to TOR networks. Yes, just in case. Your infrastructure can be infected and be a part of a botnet. And if you didn’t authorize such kind of connection you should be wary about it.
To keep the list actual you may create a cronjob that will regenerate rule files and add them to the current Falco deployment. All incidents with connections to or from the TOR network will be fixed by Falco
Aug 09 19:16:41 ip-172-31-14-16 falco[39553]: 19:16:41.546325382: Warning
Detected connection from known TOR Node to pod or host. nginx
fd=4(<4t>5.79.109.48:45532->172.17.0.2:80)
tuple=5.79.109.48:45532->172.17.0.2:80 queuepct=0 queuelen=0 queuemax=511
Mitigating DDoS attack
To create a barrier for DDoS attacks, we need several entities. The first one is Host EndPoint (HEP). This resource corresponds to the network interface where you want to enforce an attack. With the help of it, we will be able to influence traffic. In HEP we will define the node name, the name of its network interface, and the address that is associated with this. The manifest can look like this
apiVersion: projectcalico.org/v3
kind: HostEndpoint
metadata:
name: hep-for-control-plane
labels:
Apply-dos-mitigation: "true"
spec:
interfaceName: eth0
node: kind-control-plane
expectedIPs: [«172.18.0.2"]
The second resource to create is GlobalNetworkSet. There we will define the list of IP addresses to deny connections. We can get them from the script we used to create Falco rules or get them from Calico logs. Generally, the manifest can look like this:
apiVersion: projectcalico.org/v3
Kind: GlobalNetworkSet
metadata:
name: ddos-block-list
labels:
ddos-block-list: 'true'
spec:
nets:
- '1.234.21.73'
- '100.38.242.113'
- '103.109.247.10'
- ...
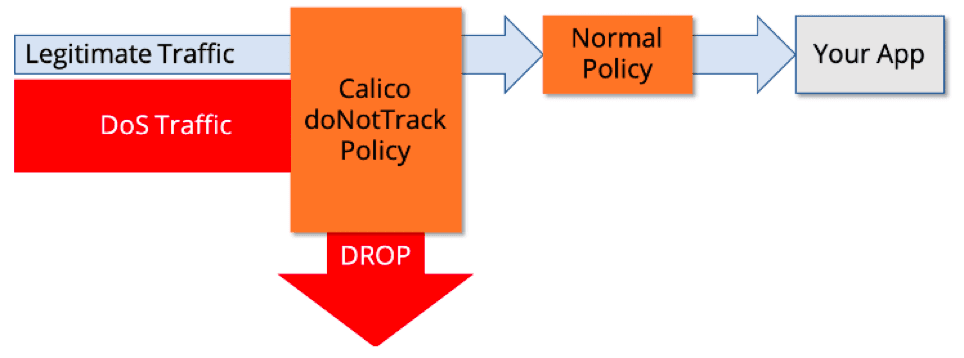
Finally, we should create GlobalNetworkPolicy which will deny incoming (or outgoing if needed) from listed IP addresses on the set network interface:
kind: GlobalNetworkPolicy
metadata:
name: dos-mitigation
spec:
selector: apply-dos-mitigation == 'true'
doNotTrack: true
applyOnForward: true
types:
- Ingress
ingress:
- action: Deny
source:
selector: ddos-block-list == 'true'
GlobalNetworkPolicy will filter all traffic, compare its source with the list of denied IP addresses, and drop the connection ID they matched.
Conclusion
DDoS is a very ancient kind of attack, but its actuality is still rather high. It can influence your application’s performance or your invoice from the cloud provider. Or both. Cloud environments can mitigate some risks but exacerbate others.
There is no 100% method to protect yourself from DDoS attacks. Advanced technical means allow generate a monstrous amount of traffic. And you won’t be able to defend against it on your own..
There are lots of quite effective commercial DDoS protection tools. They are made especially for this purpose. And can save you from the majority of attacks. If you are a big company, and high-risk for DDoS attacks, you definitely should use them.
But in this article, we wanted to show you, that even if you don’t have any specialized tools, you are not defenseless. Such joint tools like Calico and Falco can be very useful in protecting your environment from DDoS attacks and other threats.
Related Reading
- Kubernetes
- Basics
- Infrastructure