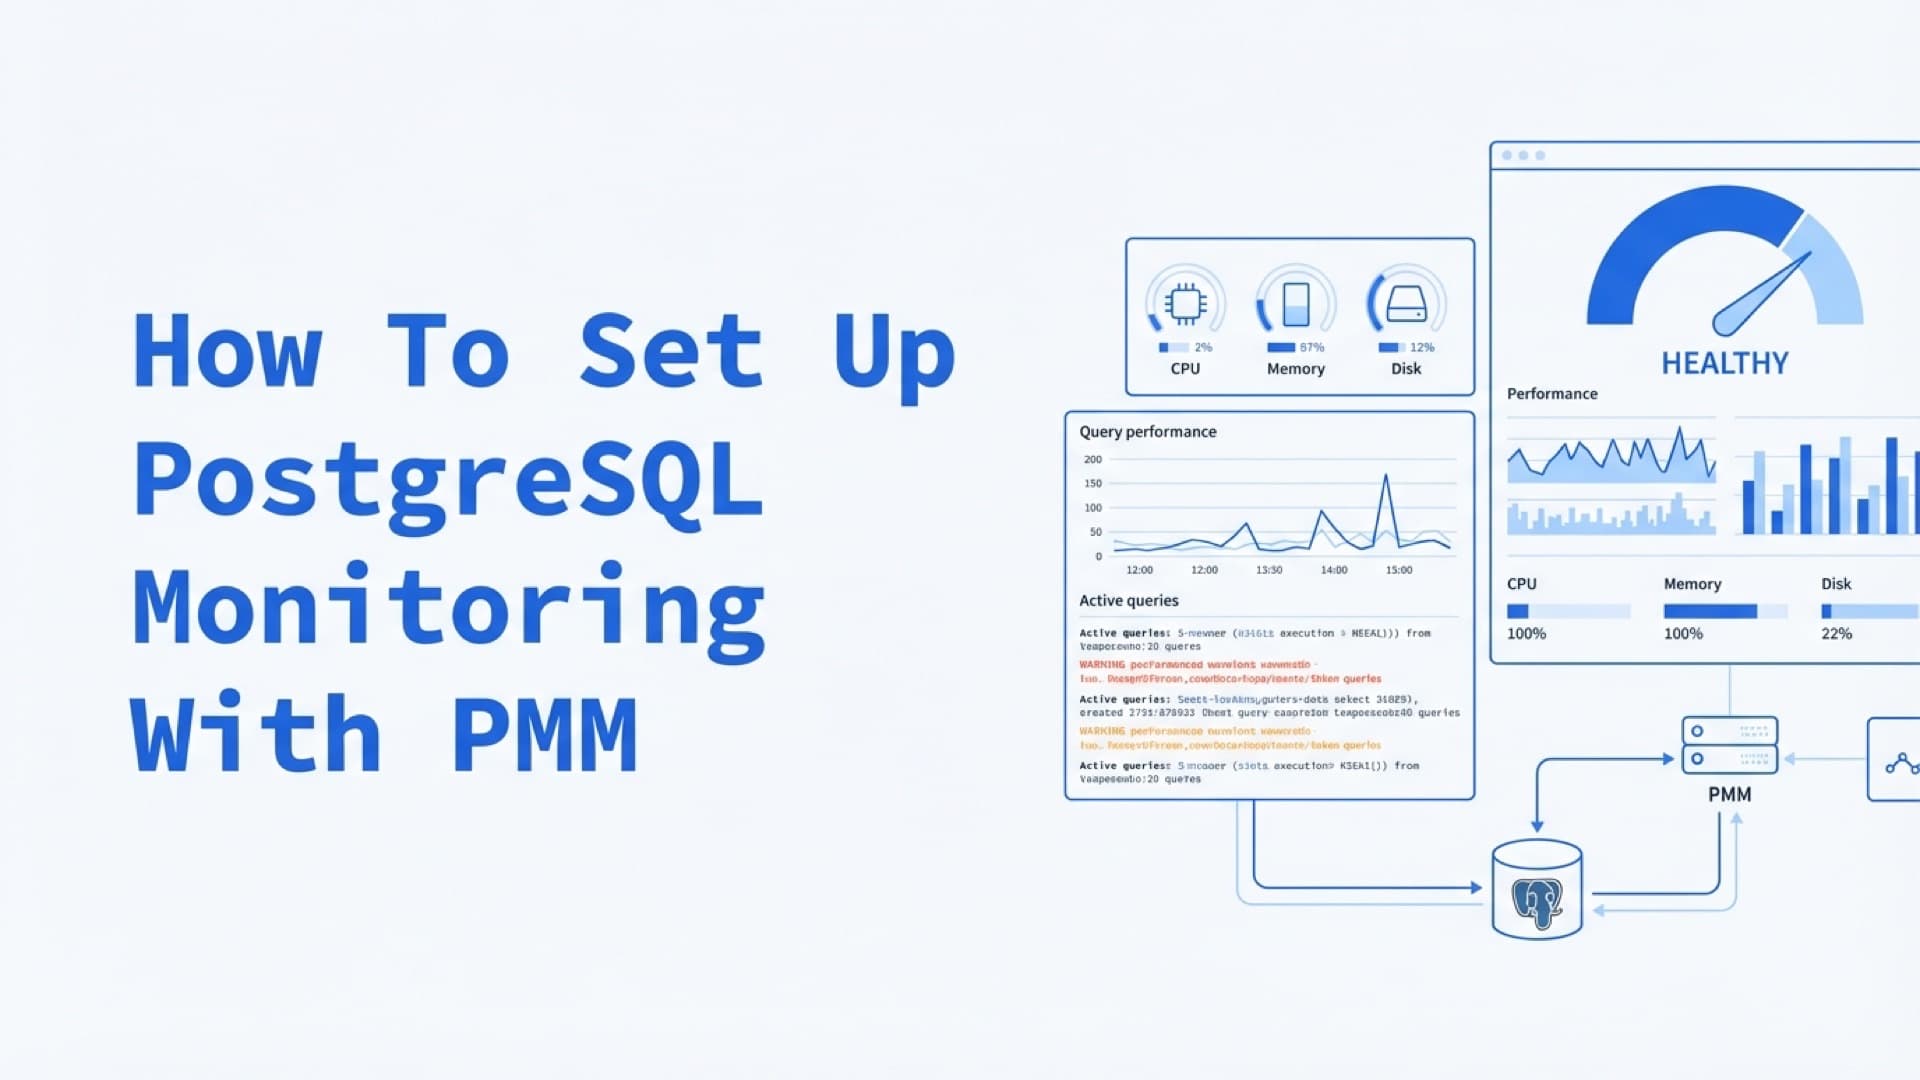
How To Set Up PostgreSQL Monitoring With PMM
 Stanislav Levchenko··Updated
Prepare your environment
Before you start setting up PostgreSQL to be connected to PMM monitoring, you need to have a PMM Client and register it on the PMM Server. Let’s do it.
You may set up the PMM Client in different ways. It can be either running in a Docker container or installed by a package manager or from sources. In this article, we will use the easiest way — we will install it from a repository using a package manager. Make sure you have curl, gnupb, wget, and sudo installed on your server. First of all, you need to add Percona repo to your repositories list.
For Debian-based OS
a. Configure repositories.
wgethttps://repo.percona.com/apt/percona-release_latest.generic_all.debdpkg -i percona-release_latest.generic_all.deb
b. Install the PMM-client package.
apt updateapt install -y pmm2-client
c. Check if it was installed correctly.
pmm-admin --version
For RedHat-based OS
a. Configure repositories.
yum install -y https://repo.percona.com/yum/percona-release-latest.noarch.rpm
b. Install the PMM-client package.
yum install -y pmm2-client
c. Check if it was installed correctly.
pmm-admin --version
After you have installed the PMM Client, you should register it on your server. You need the PMM Server hostname or an IP-address and credentials for your connection.
To register the PMM client on the server, just type:
pmm-admin config --server-insecure-tls --server-url=https://admin:<password>@XXX.XXX.XXX.XXX:443 YYY.YYY.YYY.YYY generic mynode
where XXX.XXX.XXX.XXX — IP address or hostname of PMM server, YYY.YYY.YYY.YYY — IP address or hostname of PMM client, generic — client type and mynode — mane of client.
Configure PostgreSQL
First of all, you should create a user to monitor:
CREATE USER pmm WITH SUPERUSER ENCRYPTED PASSWORD '******';
After that, it is necessary to enable the possibility for the PMM user to log in locally to the PostgreSQL instance. To it, add a rule to /var/lib/pgsql/data/pg_hba.conf file like that (the second line is given just to comment field arguments, it is not necessary to add it)
local all pmm md5# TYPE DATABASE USER ADDRESS METHOD
Reload the configuration:
su - postgres
psql -c "select pg_reload_conf()"
and check if the PMM user is able to log in:
psql postgres pmm -c "\conninfo"
When the PMM user is configured, the next step is to configure the database extension for connection to the PMM server. In this guide, we will use an official extension created by PostgreSQL pg_stat_statements. There is a new extension, created by Percona — pg_stat_monitor. It gives you additional features like bracket-based aggregation. But it is still in the beta phase and is unsupported. So you can use it at your own risk. You may install pg_stat_statement by your package manager On Debian-based OS
apt install -y postgresql-contrib
On RedHat-based OS
yum install -y postgresql-contrib
Add these lines to /var/lib/pgsql/data/postgresql.conf file
shared_preload_libraries = 'pg_stat_statements'
track_activity_query_size = 2048 # Increase tracked query string size
pg_stat_statements.track = all   # Track all statements including nested
track_io_timing = on             # Capture read/write stats
Restart the database server and install the extension:
psql postgres postgres -c "CREATE EXTENSION pg_stat_statements SCHEMA public"
Now you are ready to add postgresql service to your PMM server. To add an instance, run this command in your console:
pmm-admin add postgresql \
--username=pmm \
--password=pass \
--server-url=https://admin:admin@X.X.X.X:443 \
--server-insecure-tls
You may also do it in your PMM server user interface in Configuration -> PMM Inventory -> Add instance menu section.
Setup is Complete
Congratulations, you have successfully set up PostgreSQL monitoring with PMM. Now your database has powerful monitoring and performance features that will allow you to focus on other areas of your business. You can rest assured knowing that your database is being monitored and will give you live alerts if any big changes arise.
Need help running PMM at scale or setting up production database monitoring? See our DevOps consulting.
Frequently Asked Questions
What is PMM and why should I use it for PostgreSQL monitoring?
Percona Monitoring and Management (PMM) is an open-source database monitoring platform built on Prometheus and Grafana. It provides pre-built dashboards for PostgreSQL query performance, replication lag, connection pooling, table bloat, and vacuum activity. PMM is database-aware — unlike generic monitoring tools, it understands PostgreSQL internals and surfaces metrics like query execution time, lock waits, and index usage without custom configuration.
What is the difference between pg_stat_statements and pg_stat_monitor?
pg_stat_statements is the official PostgreSQL extension for tracking query execution statistics — total calls, time, rows returned. pg_stat_monitor is a Percona-developed alternative that adds bucket-based aggregation (showing query stats per time interval), query plan capture, and client application tracking. pg_stat_statements is production-stable and recommended for most setups. pg_stat_monitor provides richer data but should be evaluated in staging first.
How much overhead does PMM add to PostgreSQL?
PMM client adds minimal overhead. The pg_stat_statements extension itself adds some overhead to query execution, more so when track = all is enabled. For most production databases, this overhead is negligible compared to the debugging and performance insights gained. If overhead is a concern, set pg_stat_statements.track = top to monitor only top-level statements instead of all nested calls.
Related Reading
Related posts

How To Set Up Alerts Using PMM
Percona Monitoring and Management allows you to set different alerts related to your infrastructure.
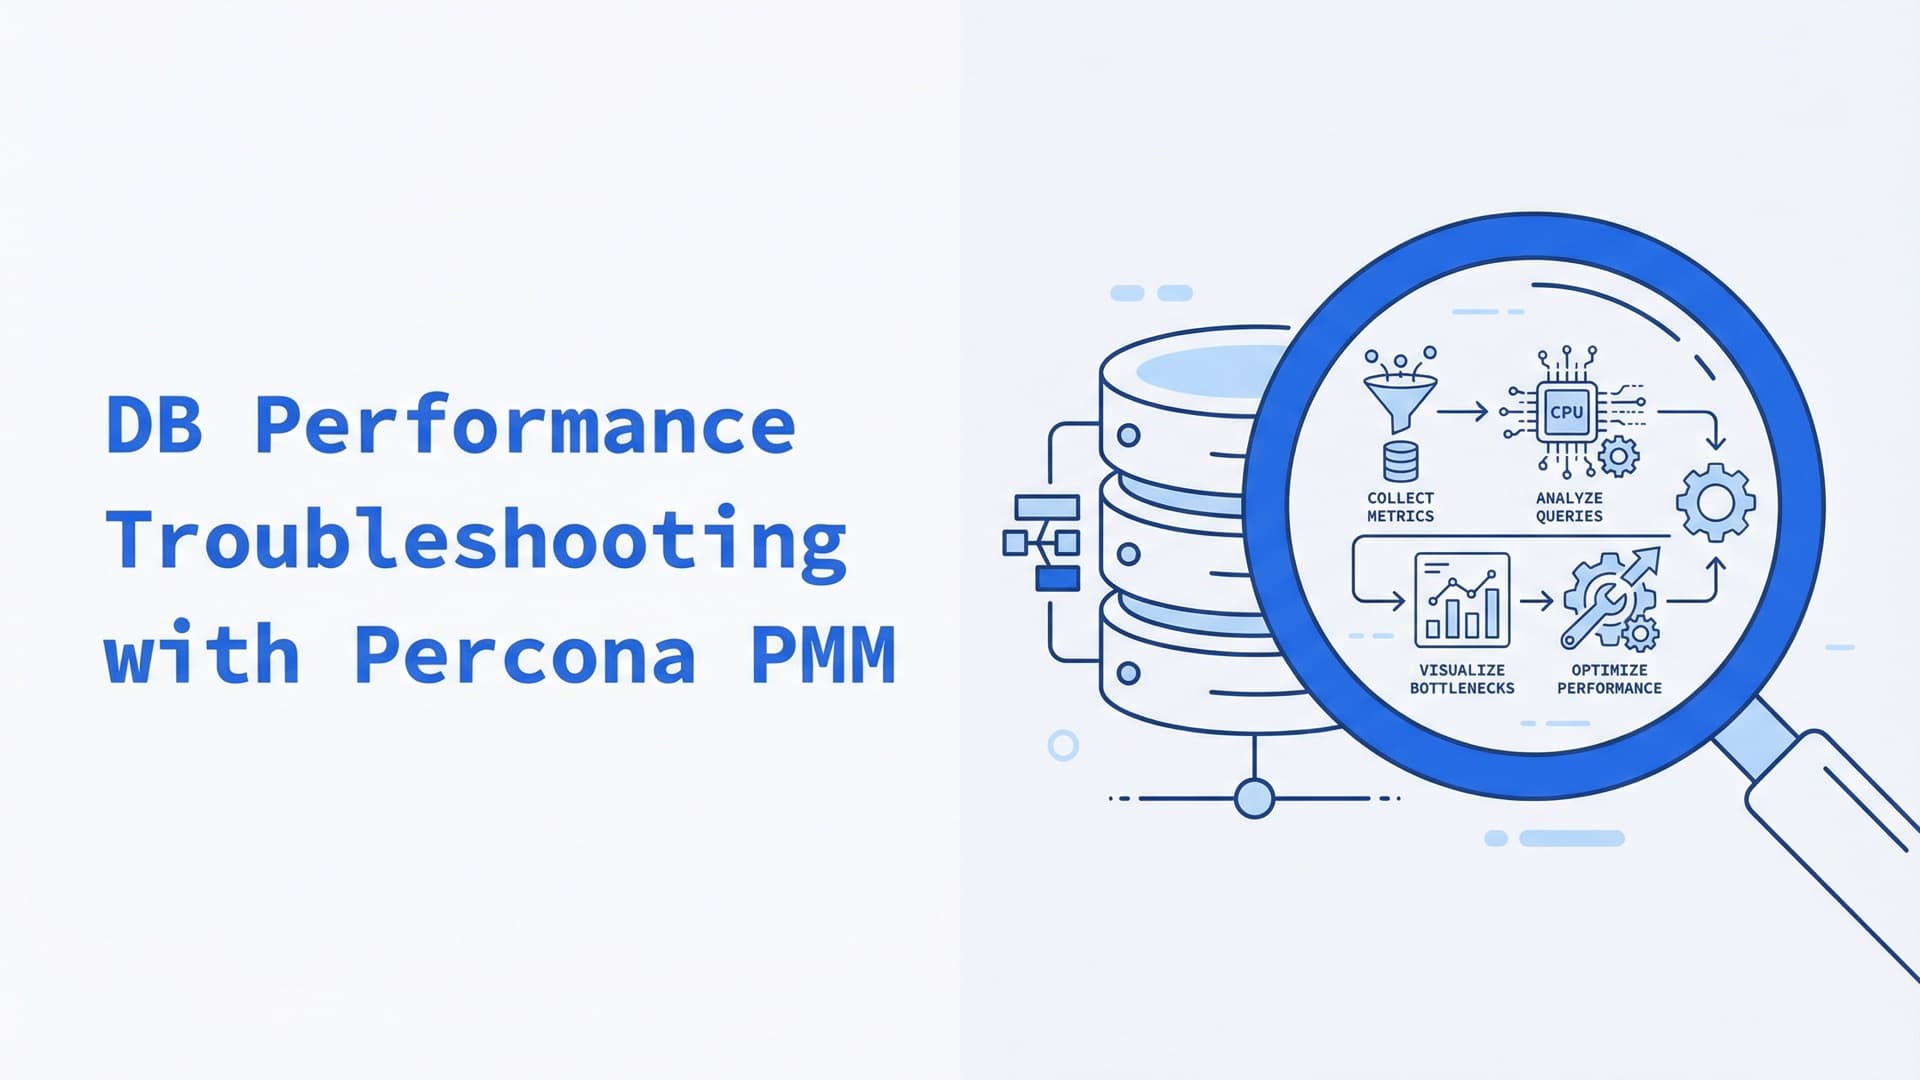
DB Performance Troubleshooting Workflow Using Percona PMM
Some time you may face with the situation when your DB became slow. You may notice it during developing your system.

3 Ways To Set Up A PMM Server
This method involves self-configuring everything you need on a virtual machine in the Linode cloud, with all the complexities and peculiarities that come...