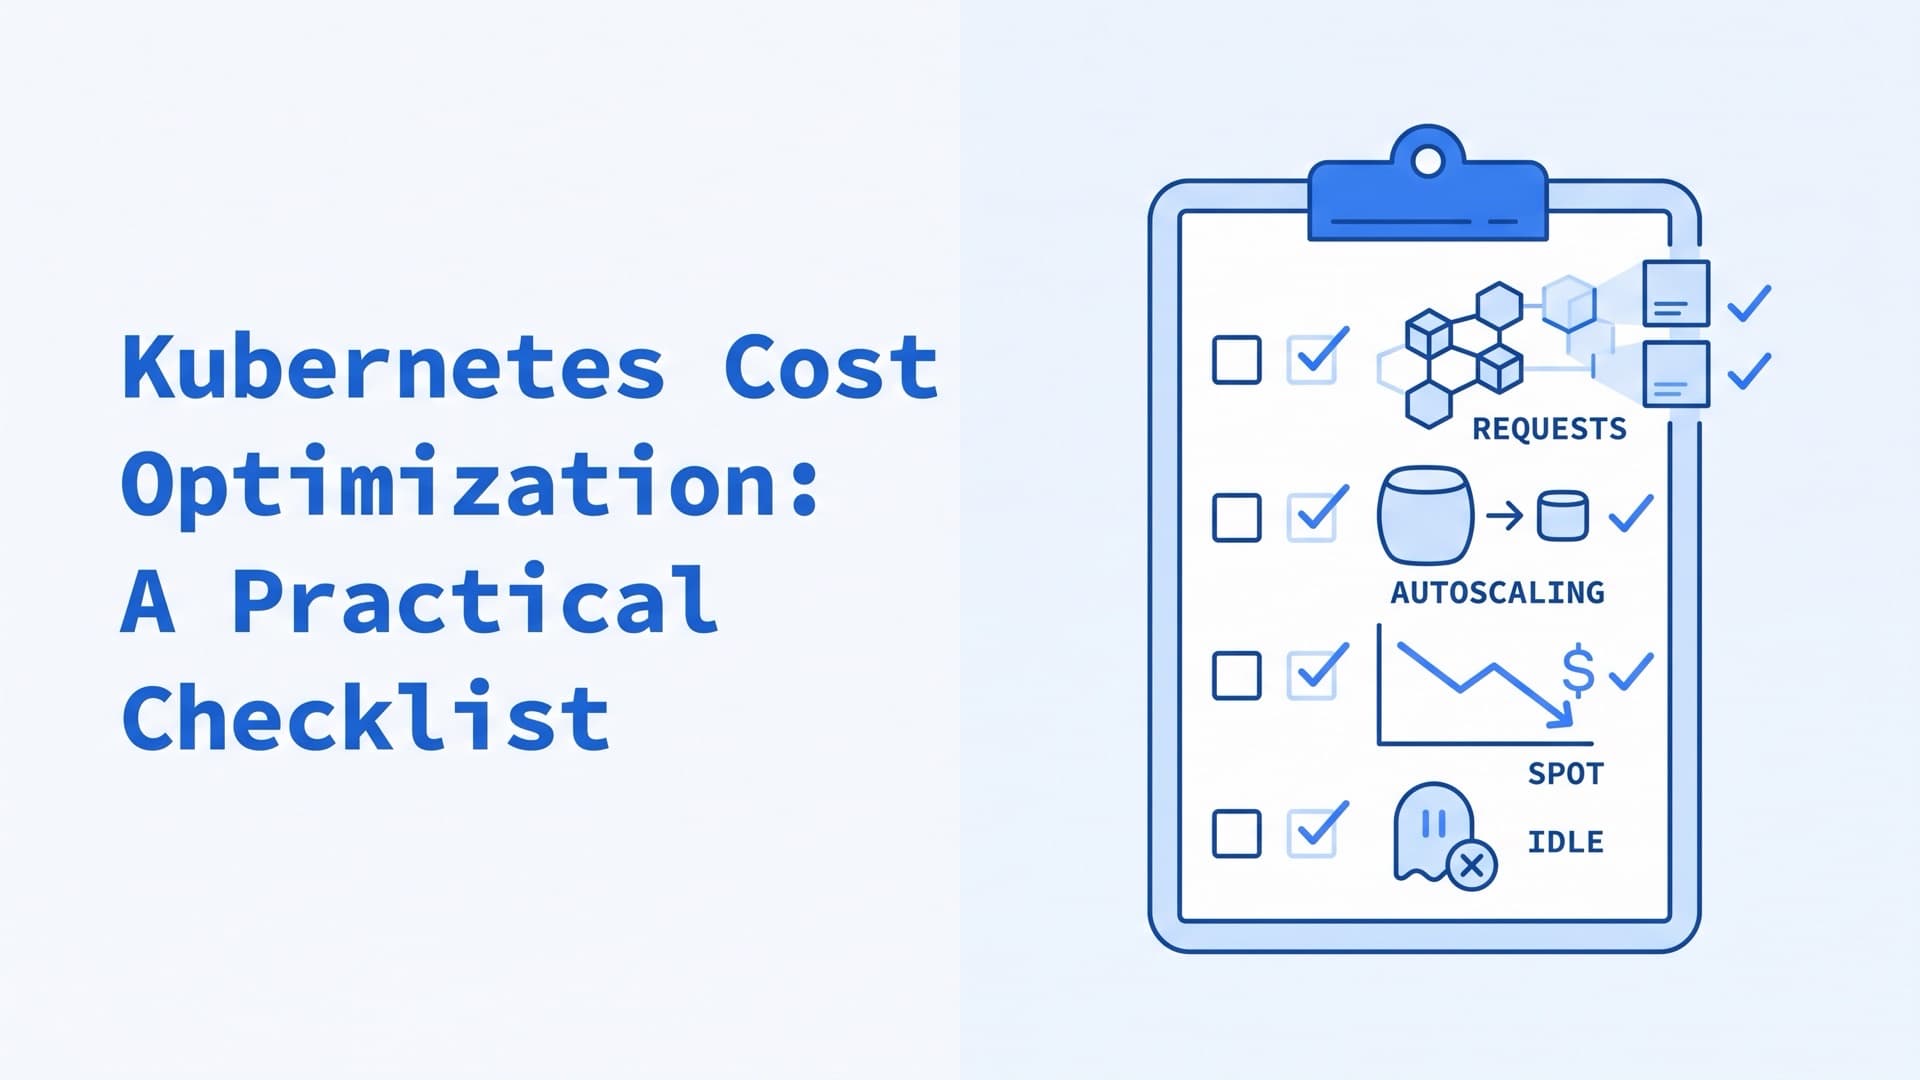
Kubernetes Cost Optimization: A Practical Checklist
 Eugene Levitin··Updated
What is Kubernetes cost optimization?
Kubernetes cost optimization means paying only for the capacity your workloads need. Clusters add nodes to fit what pods request, even when the pods use less. So the work starts with measuring requests against real usage and right-sizing them. Autoscaling, cheaper nodes and removing idle resources come next.
How to reduce Kubernetes costs, step by step
Work through these steps in order. They reflect Kubernetes 1.37, the current release, and cloud prices as of October 2026.
- Measure cost and usage per team and workload, with OpenCost or your cloud's billing data.
- Right-size CPU and memory requests, starting with the biggest requesters.
- Set default requests and quotas in every namespace.
- Autoscale pods, and let nodes follow them down.
- Buy cheaper nodes, with Spot for stateless work and commitments for the steady baseline.
- Remove idle resources, such as released volumes and unused load balancers.
- Keep clusters on supported versions to avoid extended-support fees.
Repeat the review after each major release. The tools section lists open-source and commercial tools for these steps.
What drives Kubernetes costs?
A Kubernetes bill has five main parts:
| Cost item | What drives it | First fix |
|---|---|---|
| Nodes | Pod requests, instance types, pricing model | Right-size requests |
| Storage | Volume size and type, snapshots | Delete orphaned volumes |
| Load balancers | One per LoadBalancer Service, billed hourly | Share one Ingress or Gateway |
| Network | Traffic between zones and out to the internet | Keep traffic in its zone |
| Control plane | A fee per managed cluster | Fewer clusters, supported versions |
Pod requests set the node count. The scheduler places a pod only on a node with enough unrequested capacity. It refuses even when actual usage on the node is very low. Node autoscalers also count requests and ignore real usage when they add or remove nodes.
Some managed services bill requests directly. By default, GKE Autopilot charges for the CPU, memory and ephemeral storage that running pods request. EKS on Fargate prices each pod by its requested vCPU and memory.
The gap between what you pay for and what you use can be large. Datadog's State of Cloud Costs report studied its customers' AWS bills from May 2023 to April 2024. It found that 83% of container costs went to idle resources. Overprovisioned cluster capacity made up 54%, and requests larger than workloads need made up 29%.
If you'd like a second pair of eyes on your bill, our Kubernetes consulting team starts with read-only access and a written list of what to fix first.
Kubernetes cost monitoring and allocation
Kubernetes cost management starts with cost monitoring, which splits one cluster bill into cost per namespace, team and workload. It works best when every workload carries the same labels, such as team, app and env. The split also shows where a cost spike comes from. Look first for capacity that scaled up and never came back down, new load balancers and jumps in cross-zone traffic. You can get the numbers three ways:
- OpenCost is a vendor-neutral, open-source cost monitor. It became a CNCF incubating project on October 25, 2024. It reads prices from AWS, Azure and GCP, and it supports on-prem clusters through custom pricing.
- IBM Kubecost is a commercial product from the company that first built OpenCost. IBM acquired Kubecost in September 2024 and sells it through Apptio. As of October 2026, its free Foundations tier covers up to 250 cores.
- Your cloud's billing data. On AWS, split cost allocation data adds pod-level EKS costs to the Cost and Usage Report. GKE cost allocation adds cluster, namespace and label data to the detailed billing export. The AKS cost analysis add-on is built on OpenCost and needs the Standard or Premium tier.
Tools also differ in how they charge for shared capacity. The OpenCost specification charges each workload for the larger of its request and its actual usage. That treats reserved capacity as spent, which is how the scheduler sees it. GKE cost allocation is based on requests alone.
Prometheus is enough for a first look. This query shows what share of its requested CPU each namespace uses:
sum by (namespace) (rate(container_cpu_usage_seconds_total{container!=""}[5m]))
/
sum by (namespace) (
  kube_pod_container_resource_requests{resource="cpu"}
  * on (namespace, pod) group_left ()
  max by (namespace, pod) (kube_pod_status_phase{phase="Running"})
)
A result of 0.2 means the namespace uses a fifth of the CPU it reserves. The first metric comes from the kubelet, and the other two from kube-state-metrics. The phase filter counts only running pods, because finished Job pods that still exist keep reporting their requests.
Kubernetes resource optimization: right-size requests and limits
Kubernetes resource optimization means setting each container's CPU and memory requests close to what it really uses. This is also called right-sizing. Kubernetes allocates node capacity by requests, so requests decide how many nodes you pay for. The best practices below follow this order: measure, set requests and limits, automate, then add namespace defaults and quotas.
How requests and limits work
A request is the amount the scheduler reserves for a container. A container can use more than its request when its node has spare capacity. A limit is a ceiling, and Kubernetes enforces it differently for each resource:
- CPU. A container at its CPU limit is throttled. It slows down but keeps running.
- Memory. A container over its memory limit can be killed by the kernel, which shows up as
OOMKilled.
CPU is counted in cores. 100m means 100 millicpu, or 0.1 CPU, which is a tenth of one physical or virtual core. Memory is counted in bytes, with suffixes such as Mi and Gi.
resources:
  requests:
    cpu: 100m
    memory: 256Mi
  limits:
    memory: 256Mi
This container reserves a tenth of a core and 256 MiB of memory. It has no CPU limit, and its memory limit equals its request. The section on setting limits below explains both choices.
How to find over-requested workloads
Compare requests with real usage for each container, over at least a week that includes your busiest days.
kubectl top pods --containersshows current usage. It needs the Metrics Server or another source of the Metrics API, whichkubectl top, the HPA and the VPA all use.kubectl describe nodelists each pod's requests and the node's total under "Allocated resources".- For history, use the Prometheus query above, or one of the recommenders in the tools table.
Requests drift away from usage in three ways:
- A new service gets generous requests "to make it work now". The task to lower them later never gets planned.
- The code gets faster, but nobody updates the requests.
- A service with short spikes is sized for its peak around the clock.
The waste adds up across replicas. Say a service requests 500m CPU and 512Mi of memory but uses 80m and 200Mi. At 50 replicas, it reserves 25 CPUs to do 4 CPUs of work, and 25 GiB of memory to hold about 10 GiB.
Best practices for setting requests and limits
Start from a high percentile of real usage and add a margin. Two open-source recommenders publish their defaults:
- The VPA recommender targets the 90th percentile of usage and adds a 15% safety margin. For memory, it works from daily peaks over the last eight days.
- Robusta KRR sets the CPU request at the 95th percentile, with no CPU limit. For memory, it takes the peak over two weeks of history, its default, and adds 15%. It sets the memory limit to the same value.
Then decide on limits:
- Memory. A limit equal to the request keeps the pod within the memory the scheduler reserved for it. A higher limit lets it borrow spare memory. But when the node runs short, a pod using more than its memory request is likely to be evicted.
- CPU. Without a CPU limit, a container can use idle CPU on its node. With one, its performance is more predictable. The Kubernetes blog calls this a trade-off between efficient resource usage and performance predictability. Our Kubernetes performance tuning guide covers CPU throttling.
Two details are easy to miss. If you set a limit with no request, Kubernetes copies the limit into the request. A generous limit then becomes a generous reservation. And a pod is in the Guaranteed QoS class when every container's requests equal its limits, for both CPU and memory. Guaranteed pods are the last to be evicted when a node runs out of resources.
Automate right-sizing with the VPA and in-place resize
The Vertical Pod Autoscaler (VPA) recommends requests from real usage and can apply them. It is an add-on you install, and its update mode decides what it does:
Offonly records recommendations in the VPA object. Start here.Initialsets requests when pods are created.Recreateevicts pods whose requests are far from the recommendation, so they restart with new values.InPlaceOrRecreateresizes running pods without a restart where it can, and evicts them where it can't.
The old Auto mode has been deprecated since VPA 1.5.0 and now behaves like Recreate.
In-place pod resize has been stable since Kubernetes 1.35, and the VPA's InPlaceOrRecreate mode reached GA in VPA 1.6.0. Only CPU and memory can be resized in place, and a pod keeps its QoS class.
apiVersion: autoscaling.k8s.io/v1
kind: VerticalPodAutoscaler
metadata:
  name: api-vpa
spec:
  targetRef:
    apiVersion: apps/v1
    kind: Deployment
    name: api
  updatePolicy:
    updateMode: "Off"
Read the recommendation with kubectl describe vpa api-vpa. Goldilocks does this for a whole namespace. It creates a VPA in recommendation mode for each workload and shows the results on a dashboard.
Don't let the VPA and the HPA scale on the same metric. The VPA project names two safe pairings. One is the VPA on memory with the HPA on CPU. The other is the HPA on custom or external metrics.
Set resource quotas and default requests per namespace
Two built-in objects control resource allocation per namespace. A LimitRange sets default requests and limits for containers that don't declare them, and it can cap any single container. A ResourceQuota caps the namespace's total. Use the two together. With a CPU or memory quota in place, pods that set no request or limit for it can be rejected.
apiVersion: v1
kind: ResourceQuota
metadata:
  name: compute-quota
  namespace: team-backend
spec:
  hard:
    requests.cpu: "8"
    requests.memory: 16Gi
    limits.memory: 32Gi
    requests.storage: 500Gi
    services.loadbalancers: "1"
---
apiVersion: v1
kind: LimitRange
metadata:
  name: defaults
  namespace: team-backend
spec:
  limits:
  - type: Container
    defaultRequest:
      cpu: 100m
      memory: 128Mi
    default:
      memory: 256Mi
This quota also caps total storage requests and allows one LoadBalancer Service. It leaves CPU limits out, in line with the CPU trade-off above. A LimitRange doesn't check its defaults against what a pod sets. A container that requests more than 256Mi of memory with no limit gets the 256Mi default, and the API server rejects the pod. Set both values on larger containers.
How autoscaling lowers Kubernetes costs
Autoscaling saves money only when it scales down as well as up. Each layer has a detail that decides whether it does.
Horizontal Pod Autoscaler (HPA). It adds and removes replicas as load changes. For CPU and memory, it measures utilization as a percentage of the pods' requests. It takes no action for a metric when a pod's containers lack that request. So right-sizing changes how the HPA behaves. Lower the requests and the same load reads as higher utilization, so recheck HPA targets after each round.
Cluster Autoscaler. It adds nodes when pods can't be scheduled. By default, it removes a node once the requests on it stay below 50% of its allocatable capacity for 10 minutes, if its pods fit elsewhere. Inflated requests keep half-empty nodes alive. So do restrictive PodDisruptionBudgets.
Karpenter. Like the Cluster Autoscaler, it is sponsored by Kubernetes SIG Autoscaling. The Cluster Autoscaler grows node groups you configure in advance. Karpenter picks node types for pending pods, within limits you set. By default, its consolidation removes or replaces any node when that lowers cost. Karpenter has providers for AWS, Azure and other clouds. Our Karpenter guide covers its consolidation settings.
Scale to zero. Idle dev and staging environments cost money while their pods run. Since Kubernetes 1.37, the HPA can scale to zero on object or external metrics, as a beta feature that is on by default. KEDA, a CNCF graduated project, scales on events such as queue length and drops to zero when they stop. Its cron scaler can switch an environment off outside working hours:
apiVersion: keda.sh/v1alpha1
kind: ScaledObject
metadata:
  name: api-office-hours
  namespace: staging
spec:
  scaleTargetRef:
    name: api
  minReplicaCount: 0
  triggers:
  - type: cron
    metadata:
      timezone: America/New_York
      start: 0 8 * * 1-5
      end: 0 19 * * 1-5
      desiredReplicas: "2"
Fewer pods save money only when nodes follow them down. Pair workload autoscaling with the Cluster Autoscaler or Karpenter. Our Kubernetes autoscaling guide covers what stops nodes from scaling down.
Choose cheaper nodes: Spot instances, commitments, ARM and bin packing
Spot instances. Clouds sell spare capacity at a deep discount. As of October 2026, AWS and Azure advertise up to 90% off on-demand prices, and Google Cloud up to 91%. The provider can take the capacity back at short notice. AWS warns two minutes ahead, and Azure up to 30 seconds ahead. Google Cloud gives a Spot VM a best-effort shutdown period of up to 30 seconds, and you can add a 120-second preemption notice before it.
Run stateless services, batch jobs and CI runners on Spot, and keep databases on on-demand nodes. Set PodDisruptionBudgets (PDBs) so a drain evicts only a few replicas at a time. A PDB can't stop the reclaim itself, so also spread replicas across nodes and zones. Allow many instance types, too. AWS suggests at least 10 per workload. On AWS, Karpenter with interruption handling enabled starts a replacement node as soon as it sees the warning.
Commitments for the baseline. Capacity that runs all the time costs less with a one- or three-year commitment. The programs are AWS Savings Plans, Google committed use discounts and Azure reservations. Commit after right-sizing, so you don't lock in the waste.
ARM nodes. AWS says its Graviton instances cost up to 20% less than comparable x86 instances. Google Cloud (Axion) and Azure (Cobalt 100) sell ARM machines too. Your images need an arm64 build, because an amd64 container can't run on an arm64 host without emulation.
Node size. Each DaemonSet, such as a log or metrics agent, runs a copy of its pod on every node it targets. Each node also keeps part of its capacity for system daemons. Many small nodes repeat that overhead many times. Larger nodes spread it thinner, but each one takes more pods down when it fails.
Bin packing. By default, kube-scheduler favors the least allocated nodes, which spreads pods out. If you run your own scheduler configuration, the MostAllocated strategy packs pods onto fuller nodes so others can empty. On GKE, the optimize-utilization autoscaling profile prefers fuller nodes and scales down faster. Karpenter's consolidation repacks pods onto fewer nodes. Our post on choosing cloud instances for Kubernetes covers instance families.
How to reduce idle resources in Kubernetes
Idle resources keep billing after the workloads that needed them are gone. Most of this list is storage: volumes, disks and snapshots. Check these regularly:
- Released volumes. With the
Retainreclaim policy, deleting a claim leaves the volume in theReleasedphase. The cloud disk survives even after you delete the PV. Dynamically provisioned volumes default toDelete. - StatefulSet volumes. Scaling a StatefulSet down, or deleting it, keeps its PVCs by default. Set
persistentVolumeClaimRetentionPolicyif they should go too. - Unattached disks left behind by deleted nodes, clusters or PVs.
- Older disk types. As of October 2026, AWS says gp3 costs up to 20% less per GB than gp2 and includes 3,000 IOPS at any size. With Elastic Volumes, an existing volume can change type without detaching.
- Snapshots with no retention period. Keep what your recovery plan needs.
- Load balancers. Each
LoadBalancerService provisions a cloud load balancer. AWS, for one, charges for each hour or partial hour it runs. Route HTTP services through a shared Ingress or Gateway, and cap the count with theservices.loadbalancersquota. - Forgotten namespaces from demos, tests and old feature branches. Give temporary ones an owner label and a delete-by date.
- Cross-zone traffic. As of October 2026, AWS charges $0.01 per GB in each direction for data that moves between Availability Zones in the same Region. The sending and the receiving side are both billed, so a gigabyte that crosses zones costs $0.02. A Service with
trafficDistribution: PreferSameZonekeeps traffic in the client's zone when it has an endpoint there.
# Volumes whose claim has been deleted
kubectl get pv | grep Released

# Services that each create a cloud load balancer
kubectl get svc --all-namespaces | grep LoadBalancer

# Unattached disks on AWS, Google Cloud and Azure
aws ec2 describe-volumes --filters Name=status,Values=available
gcloud compute disks list --filter="-users:*"
az disk list --query '[?managedBy==`null`].[id]' -o tsv
EKS, GKE and AKS pricing: control-plane fees and extended support
Most managed services charge a fee per cluster on top of the nodes. As of October 2026:
| Service | Standard | Extended support | Free option |
|---|---|---|---|
| Amazon EKS | $0.10/hour | $0.60/hour | None |
| Google GKE | $0.10/hour | $0.60/hour | $74.40 monthly credit |
| Azure AKS | $0.10/hour, Standard tier | $0.60/hour, Premium tier | Free tier |
On EKS, the fee jumps sixfold once a version leaves standard support, 14 months after its release on EKS. Extended support then lasts 12 more months. GKE charges the same $0.60 for clusters on its Extended channel once they pass standard support. On AKS, the $0.60 rate is the Premium tier, which buys Long Term Support. AKS Automatic and EKS Auto Mode add management fees of their own.
GKE's credit covers one zonal or Autopilot cluster per billing account each month. As of October 2026, Microsoft's pricing page lists no cluster fee for the AKS Free tier. That tier has no financially backed SLA and is recommended for clusters under 10 nodes.
At $0.10 an hour, the fee comes to about $73 a month per cluster. It matters most when you run many small clusters, or leave clusters on old versions.
Why are Kubernetes costs so high after a migration?
Kubernetes savings come from features such as bin packing and autoscaling. These cost savings depend on requests that match real usage and nodes that fit the workload. Right after a migration, several things push the bill the other way:
- Requests nobody revisited. Services keep the generous requests from their first deploy, as described in the right-sizing section above.
- One instance type for everything. General-purpose nodes are the easy default. Some workloads fit compute-optimized or memory-optimized instances better, and some can run on Spot.
- More clusters than needed. Each cluster brings its own control-plane fee, monitoring stack, DaemonSets and load balancers.
- The team's time. Someone has to set up the clusters, upgrade them, patch them and debug them. Count those hours as part of the bill. Managed services take the control plane, and on some plans the nodes, off your hands.
- The migration itself. Application changes, running old and new systems side by side, and new tooling all cost money before any savings arrive.
Treat capacity planning as ongoing work. Compare requests with usage after every major release. Our post on Kubernetes capacity planning covers the forecasting side.
Is bare metal cheaper than cloud for Kubernetes?
For small clusters, a managed cloud service is usually the simpler choice, because running your own hardware takes people and time. As clusters grow and load gets steadier, bare metal can come out cheaper. Steady load favors bare metal, and spiky load favors cloud with autoscaling. Price both options, including the people who run the hardware. OpenCost can price on-prem clusters with your own hardware costs.
We moved a long-term client's big-data platform onto on-prem Kubernetes, and we still run those clusters. Our guide to Kubernetes on bare metal covers the published cost studies and what running your own servers takes.
Kubernetes cost optimization tools
The tools below cover cost visibility, right-sizing and scaling.
| Tool | What it does | Type |
|---|---|---|
| OpenCost | Cost allocation by namespace, label and pod | Open source, CNCF incubating |
| IBM Kubecost | Cost allocation and savings recommendations | Commercial, free tier up to 250 cores |
| Cloud billing data | Pod- or namespace-level costs in the cloud bill | Built into AWS, Google Cloud and Azure |
| Vertical Pod Autoscaler | Request recommendations or automatic updates | Open source, Kubernetes add-on |
| Goldilocks | VPA recommendations for a whole namespace | Open source, Fairwinds |
| KRR | Request and limit recommendations from Prometheus data | Open source, Robusta |
| Cluster Autoscaler | Adds and removes nodes in node groups | Open source, SIG Autoscaling |
| Karpenter | Picks, provisions and consolidates nodes | Open source, SIG Autoscaling |
| KEDA | Event-driven scaling, including to zero | Open source, CNCF graduated |
| Cast AI, ScaleOps, PerfectScale by DoiT | Change requests and nodes automatically | Commercial |
| CloudZero, Vantage, IBM Cloudability | Cost reporting for the whole cloud bill, Kubernetes included | Commercial |
Commercial platforms bundle these jobs and save integration work. The open-source tools in the table cover much of the same ground if you have the people to run them.
If you'd rather not work through this checklist alone, our Kubernetes consulting team starts with read-only access and a written list of what to fix first. If Kubernetes is more than you need, we say so.
Frequently Asked Questions
What does 100m CPU mean in Kubernetes?
100m means 100 millicpu, which equals 0.1 CPU. In Kubernetes, one CPU is one physical core or one virtual core, depending on the node. So a container that requests 100m reserves a tenth of a core. Kubernetes doesn't accept CPU values more precise than 1m, or 0.001 CPU.
How do I check CPU and memory usage in Kubernetes?
Run kubectl top pods --containers for current usage; it needs the Metrics Server or another Metrics API provider. Run kubectl describe node to see each pod's requests and the node's allocated total. For history, use Prometheus with kube-state-metrics, or a recommender such as Goldilocks or KRR that compares usage with requests.
How much can Kubernetes cost optimization save?
Kubernetes cost savings depend on how far your requests and nodes sit above real usage, so measure that gap first. Datadog's State of Cloud Costs report shows how large it can be. In its customers' AWS bills from May 2023 to April 2024, 83% of container costs went to idle resources. Some idle capacity is headroom you need.
Should Kubernetes costs be allocated by requests or by actual usage?
Charge each workload for the larger of its requests and its actual usage, as the OpenCost specification does. A request reserves capacity whether it is used or not, so charging by usage alone hides waste. Charging by requests alone misses pods that burst above their reservation. GKE cost allocation, for example, uses requests only.
Is Kubernetes free to use?
Kubernetes itself is free, open-source software under the Apache 2.0 license. You pay for the nodes, storage, load balancers and traffic it runs on, and most managed services add a fee per cluster. As of October 2026, EKS and GKE charge $0.10 per cluster per hour, and Microsoft's pricing page lists no cluster fee for the AKS Free tier.
What is the difference between cost optimization and cost cutting?
Cost cutting lowers spend by doing less, such as removing capacity or environments the business still uses. Cost optimization lowers the cost of the same work through right-sized requests, autoscaling, cheaper node types and removing idle resources. Optimization keeps performance and reliability targets in place. Cutting can trade them away.
Related Reading

CEO, Ivinco
CEO of Ivinco, a senior engineering team in production since 2009. Currently exploring how AI agents are reshaping e-commerce infrastructure.
Related posts
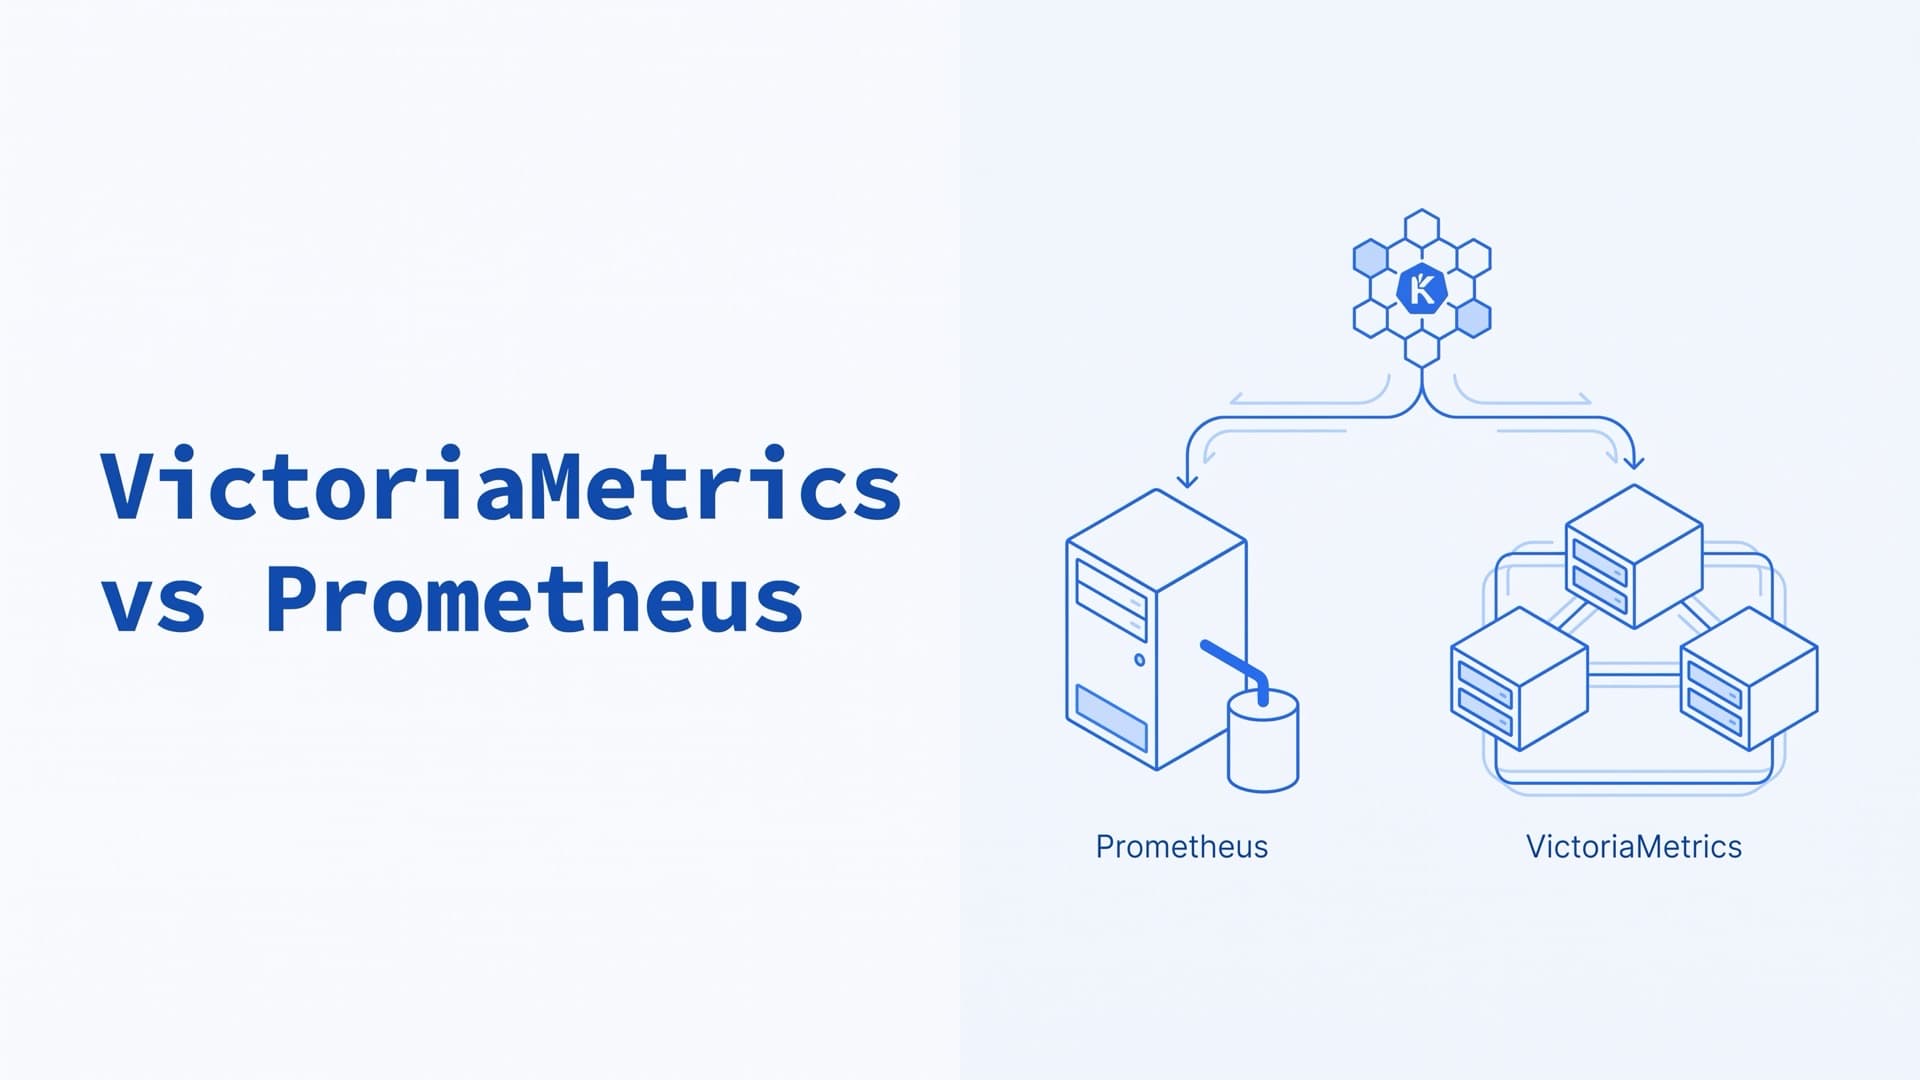
VictoriaMetrics vs Prometheus: Differences & When to Switch
VictoriaMetrics doesn't have to replace Prometheus. Compare storage, HA, MetricsQL, Enterprise features, Thanos, Mimir and migration, as of October 2026.
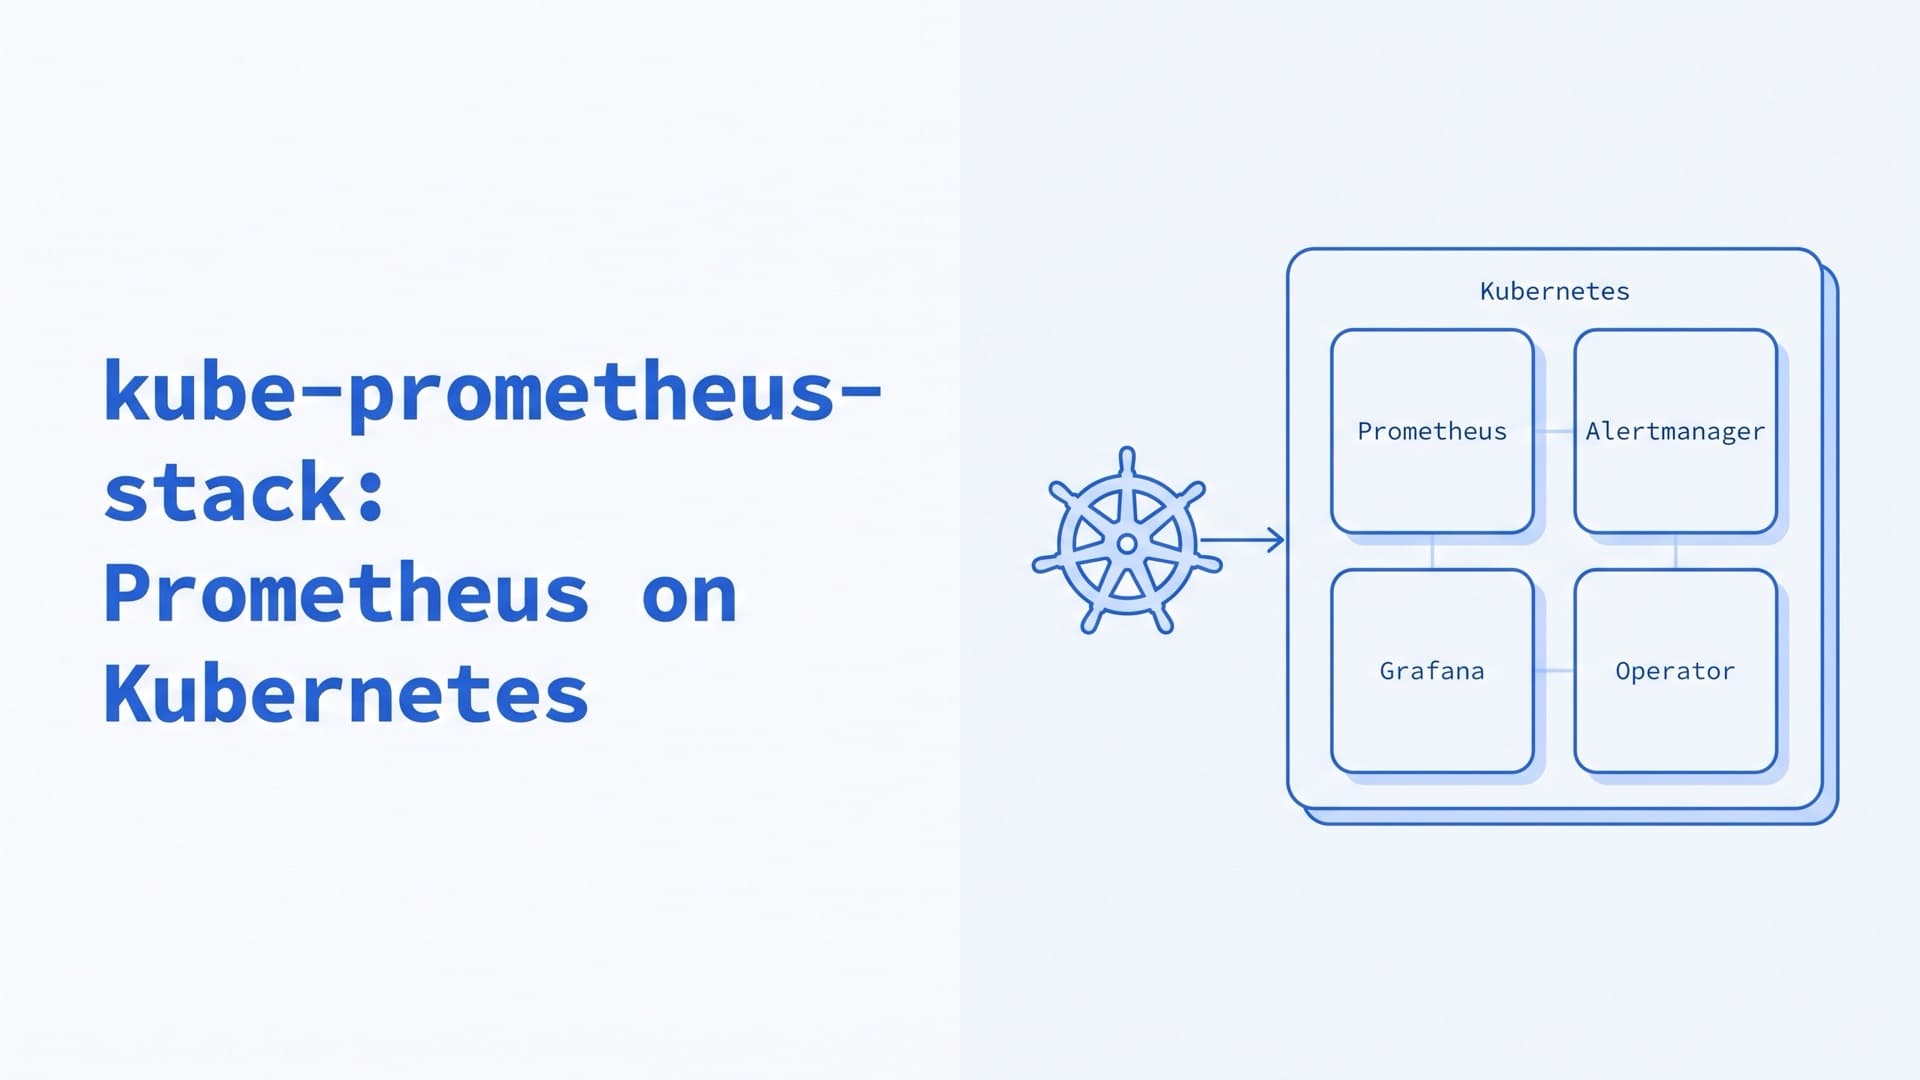
kube-prometheus-stack: Prometheus on Kubernetes
How to run kube-prometheus-stack and the Prometheus Operator in production: Helm values, ServiceMonitors, alerts, CRD upgrades, storage and remote_write.
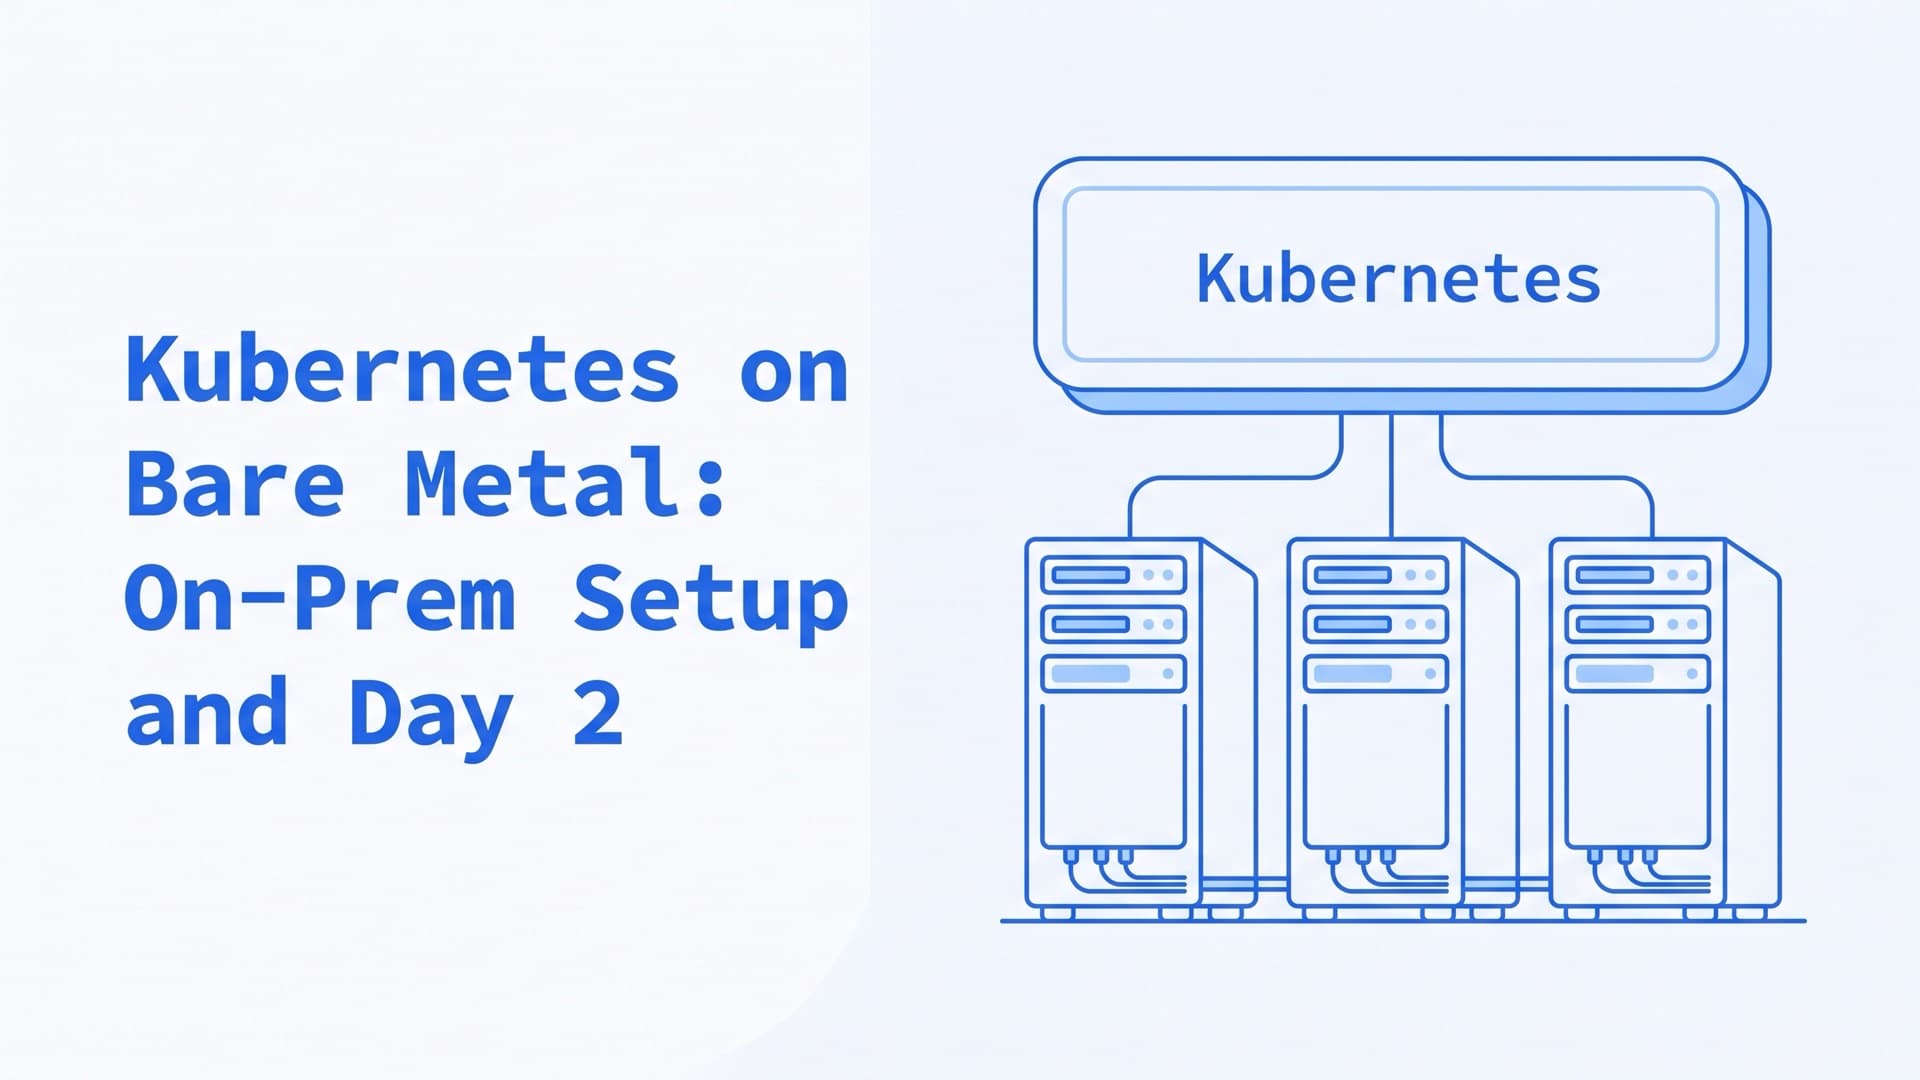
Kubernetes on Bare Metal: On-Prem Setup and Day 2
How to run Kubernetes on bare metal and on-premise in 2026: provisioning, distributions, HA, load balancing, storage, upgrades, costs and our on-prem work.