Data Pipeline Observability: Monitoring Airflow + dbt Without Drowning in Alerts
Walk into most mid-size data teams and the monitoring surface looks the same: 200+ dbt tests, 80 alerts per week, and a Slack channel muted since Q3. The tests run. The alerts fire. Nobody is reading them.
Then the real incident arrives — a revenue number off by 12% because a join key silently drifted — and the pipeline is green. The finance team finds it before the data team does.
This is Alert Debt: the accumulated cost of warnings nobody processes. Every un-owned severity: warn test contributes to it, alongside shared-channel alert routing and PagerDuty integrations that page on every Airflow retry. The debt compounds until the team's alert surface is functionally decorative — technically wired up, not doing the job it was installed to do.
Data observability is the category of tooling built to avoid that outcome. The investment thesis is clear: Gartner projects 50% of enterprises with distributed data architectures will adopt data observability by 2026, up from roughly 20% in 2024. The execution thesis is harder, because most of the tools let you add signals faster than your team can triage them.
This is a playbook for monitoring Airflow + dbt pipelines without accumulating Alert Debt.
The Five Pillars Worth Monitoring
Monte Carlo's canonical framing splits data observability into five pillars:
- Freshness. When did this table last update? Is it on schedule?
- Volume. Did the row count change in a way that's consistent with normal operations?
- Schema. Did columns get added, dropped, renamed, or retyped?
- Quality. Are values within expected ranges? NULL rates stable? Distributions consistent?
- Lineage. When something breaks, what downstream consumers are affected?
Every mature monitoring setup covers all five. What differs is where the monitoring lives — in dbt tests, in the orchestrator's native metrics, in an observability SaaS, or in custom code.
The industry numbers on failure cost are sobering. Monte Carlo reports that typical data incidents have roughly 4 hours time-to-detect and 9 hours time-to-resolve on industry averages. Their rough estimate: annual incidents ≈ tables divided by 15. A 1,500-table warehouse produces ~100 incidents a year under typical conditions. Those aren't Slack alerts — those are real quality issues where someone had to intervene.
What Airflow Gives You for Free
Airflow exposes a lot out of the box, and most teams under-use it.
Airflow's metrics system ships counters, gauges, and timers for task outcomes, DAG runs, scheduler health, executor capacity, and pool utilization. The high-value signals:
ti_failures— task instance failures (counter)dagrun.duration.success.{dag_id}— DAG run duration by outcome (timer)scheduler.tasks.executable— backlog of runnable tasks (gauge)pool.starving_tasks.{pool_name}— tasks blocked on pool capacity (gauge)dag_processing.import_errors— DAGs that failed to parse (counter)
These ship to StatsD or OpenTelemetry via standard configuration:
[metrics]
statsd_on = True
statsd_host = localhost
statsd_port = 8125
statsd_prefix = airflow
From StatsD, Prometheus scrapes them. From Prometheus, Grafana renders them. That stack is free, widely deployed, and answers most "is the orchestrator healthy" questions without reaching for SaaS.
What Airflow does NOT give you: data-level monitoring. Airflow checks exit codes. If your task ran dbt run and dbt returned 0, Airflow considers the task successful, regardless of whether the resulting data is correct.
What dbt Gives You for Free
dbt's test artifact is the foundation of dbt-based observability. Every dbt test run produces a run_results.json artifact that records which tests ran, which passed, which failed, and how long each took. Every dbt run produces a similar artifact for model runs. The manifest.json captures the full project graph.
Four built-in tests cover most needs: unique, not_null, accepted_values, relationships. Custom singular tests extend to anything expressible in SQL.
Source freshness is the underused feature. Configuring freshness: in sources.yml tells dbt to warn or error when a source table hasn't updated in an expected window:
sources:
  - name: stripe
    freshness:
      warn_after: {count: 6, period: hour}
      error_after: {count: 24, period: hour}
    loaded_at_field: _etl_loaded_at
    tables:
      - name: charges
Without source freshness, staleness is invisible until someone notices a stale dashboard. With it, the pipeline fails before the bad data propagates.
What dbt does NOT give you: anomaly detection on row counts, distribution drift, or column-level lineage across non-dbt systems. Those gaps are where the observability tools enter.
Elementary: The Open-Source dbt-Native Option
Elementary is open-source, dbt-native, and serves 1,000+ teams. It installs as a dbt package, reads dbt artifacts, and writes observability data back to your warehouse. The feature set matters:
- dbt test result tracking. Every test run is logged, with trends and regression detection.
- Anomaly detection. ML-based detection on freshness and volume metrics for any model.
- Schema change monitoring. Alerts when tables, columns, or types change.
- Slack, Teams, PagerDuty, Opsgenie alerts. With lineage context showing downstream impact.
Elementary Cloud adds hosted dashboards, team management, and SLAs. The open-source CLI is enough for most teams — installation is a dbt package and a cron job. For dbt-heavy stacks, this is the lowest-friction entry into real observability.
Monte Carlo: The Enterprise SaaS
Monte Carlo monitors 150+ enterprises including CNN, JetBlue, HubSpot, and Toast. The product is ML-based anomaly detection across the 5 pillars, with automated metadata ingestion from warehouses, BI tools, and orchestrators. Pricing typically starts around $100K/year for enterprise contracts per third-party analyses — which puts Monte Carlo well out of mid-market reach.
What Monte Carlo does well: integrates without requiring deep pipeline code changes. What it does badly from a buyer's perspective: obscures enough of the detection logic that teams struggle to tune it when it produces noisy alerts.
For context on the other tools in this category, see our data quality testing comparison, which covers Great Expectations, Soda, and dbt tests in more depth.
The Alert Debt Problem
Alert Debt accumulates in three predictable stages.
Stage 1: Everything is an alert. A new observability tool gets installed and every signal ends up routed to Slack. On-call engineers get paged for every not_null failure, every freshness miss, every Airflow retry. By the fourth week, the ratio of signal to noise has degraded to the point where humans filter the channel out of habit.
Stage 2: Selective muting. Teams start silencing channels one by one. The #data-alerts channel is muted-by-default; alerts migrate to another channel that meets the same fate a month later. The only signals anyone still sees are the ones that pass through @here escalation or ticket routing.
Stage 3: Only pages matter. The team now has two tiers of signal — PagerDuty and ignored. Pages produce action. Alerts don't. The problem is that PagerDuty is expensive (human sleep) and most data issues do not warrant a page. Distribution drift at 2 AM doesn't need to wake someone up; it needs a ticket for morning review.
Pages or silence. No middle gear.
The Three-Tier Alert Architecture
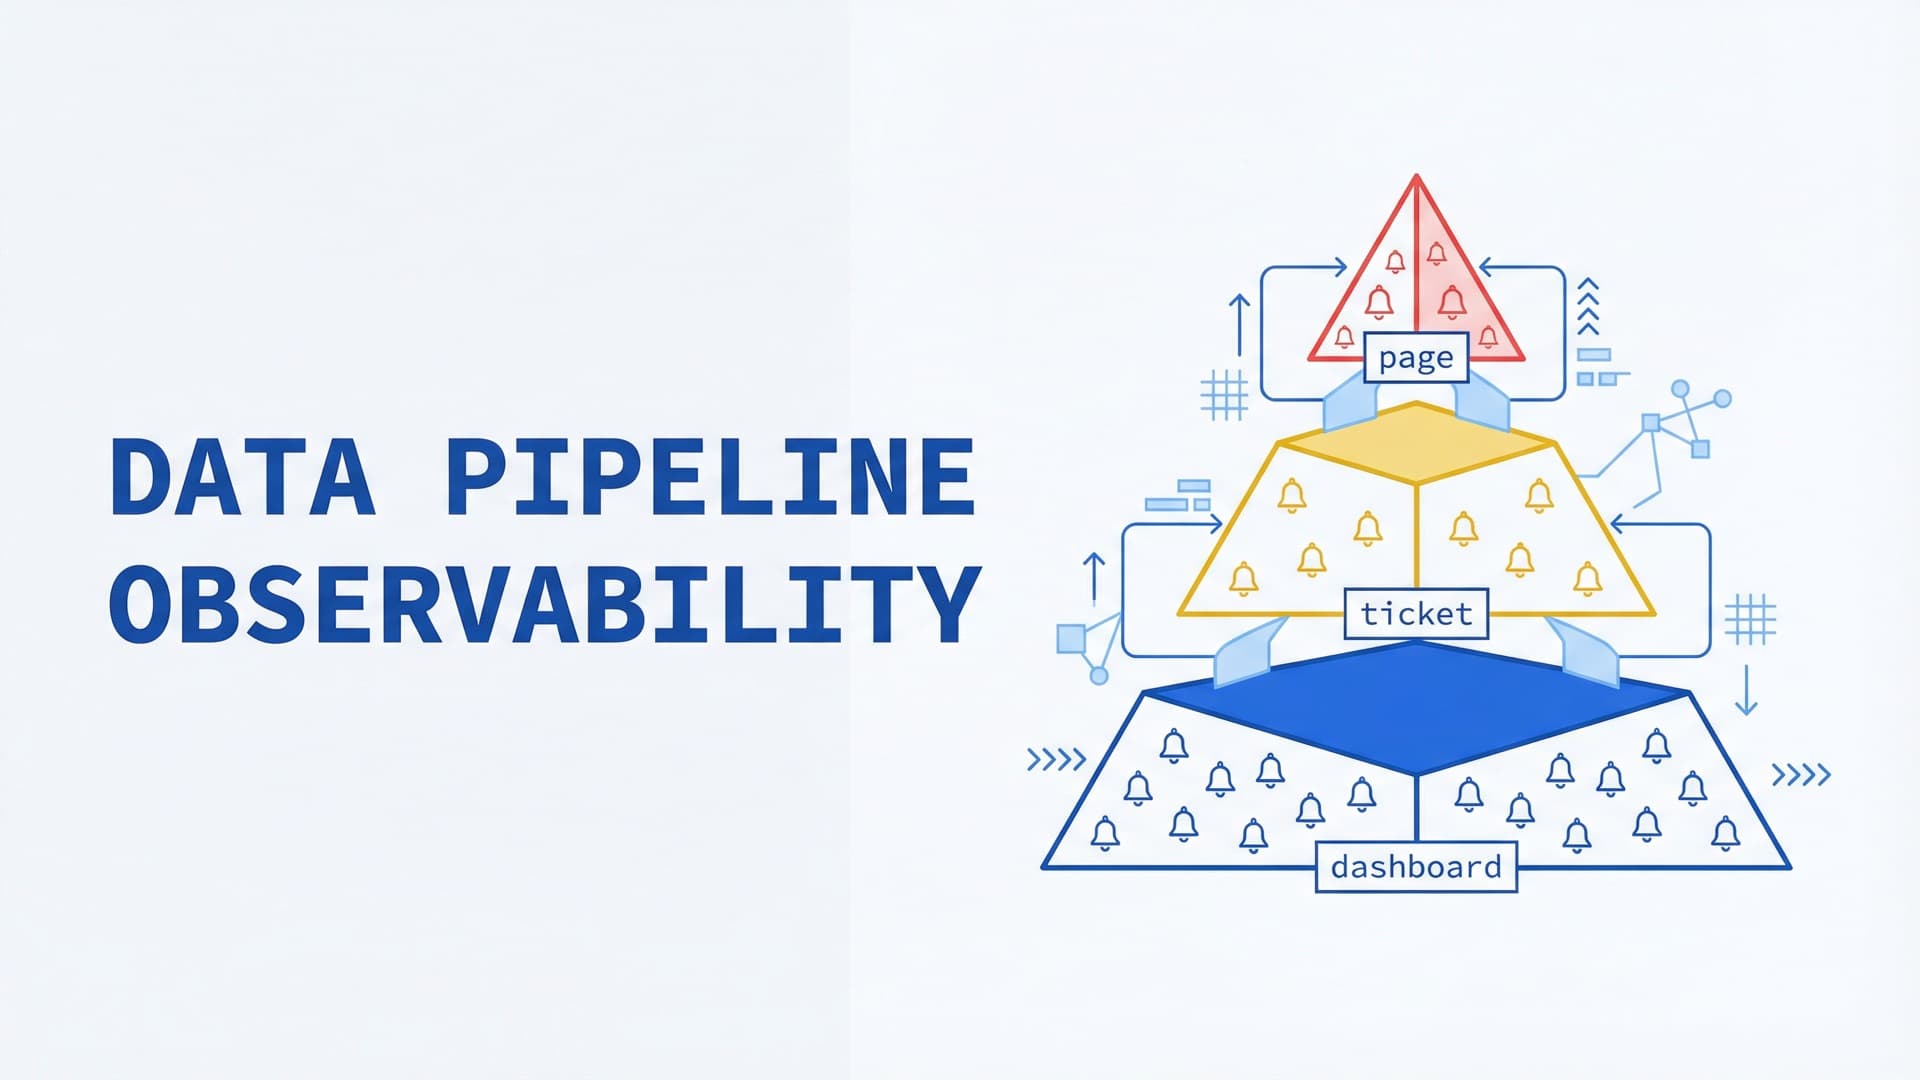
Alert Debt is prevented by tiering signals to the right response:
- Tier 1: Page. Wake someone up. Reserved for customer-visible data incidents, regulatory breach risks, and SLA misses on revenue-critical pipelines. Kept rare on purpose — every Tier 1 alert should earn the interruption.
- Tier 2: Ticket. Create a Jira/Linear/Shortcut ticket with an owner, triaged on the team's normal cadence. Freshness misses that don't threaten customer commitments, schema changes, anomaly detections with business impact.
- Tier 3: Dashboard. No alert. Visible on a weekly review dashboard. Test failures on non-critical models, low-severity distribution drift, volume fluctuations within historical bounds.
The rule: every Tier 1 alert must be actionable in under 15 minutes. Every Tier 2 ticket must have an owner and an SLA. Everything else goes to a dashboard and is reviewed weekly, never alerted on.
Most teams skip Tier 3 entirely — they try to alert on everything or monitor nothing. The dashboard tier is where the bulk of signals belong.
What to Measure, What to Ignore
The observability scope that produces value without producing noise:
Always measure
- Source freshness on every ingested table (dbt
freshness:or equivalent) - Primary key uniqueness on every staging and mart model (
uniquetest) - Primary key non-nullness (
not_nulltest) - DAG run success/failure for every production schedule
- Row count anomalies on high-revenue marts (Elementary or custom SQL)
Sometimes measure, usually ticket not page
- Distribution drift on numeric columns (alert rate is too high to page)
- NULL rate drift on any column (business-context-dependent)
- Schema changes (usually planned; ticket for review)
- dbt model runtime regression (performance signal, not correctness)
Monitor but rarely alert
- Airflow scheduler heartbeat (alerts tend to be self-resolving)
- Individual task retries (normal behavior; only care about consistent patterns)
- Pool utilization (plan capacity, don't alert on saturation)
Never alert on
- Test warnings set to
severity: warnin dbt (by definition not urgent) - Models that haven't been queried in 90 days (low-value noise)
- Orchestrator log volume (infrastructure metric, not data quality)
Debugging Playbook: When a Pipeline Breaks
A pipeline incident generally follows one of three shapes. The diagnostic sequence is the same.
Shape 1: The pipeline failed loudly. Airflow shows a red task. The test output is in the logs. Start with the failing test: what does it check, what did it see. Walk upstream: what was the input row count, what columns existed. Most loud failures resolve in under 30 minutes if the lineage graph is available.
Shape 2: The pipeline ran green but the data is wrong. Someone downstream reported a number that doesn't match. The pipeline logs are useless; they all succeeded. Start with the last known good: git log on dbt models, git log on ingestion configs, compare to current. Diff the row counts between runs. If a silent join drift occurred, the row counts usually tell you. This is where Elementary's anomaly history earns its cost — you can see the exact run where the count shifted.
Shape 3: The pipeline is slow, not broken. A DAG that used to run in 20 minutes now runs in 2 hours. Start with the slowest model (dbt's run_results tracks this). Profile the query in the warehouse. Usually: data volume grew, a join plan changed, or a cluster key drifted. Rarely a dbt problem; usually a warehouse problem surfaced by dbt.
The key ops discipline: every post-incident review produces either a new test, a new alert threshold, or an accepted reduction in monitoring. "We'll just pay more attention" is not an outcome; it's the absence of one.
Honest Boundary
We don't have a universal rule for how many alerts are too many, or what percentage of tests should be severity: error versus severity: warn. Team-specific factors dominate: the business criticality of the warehouse, the size of the on-call rotation, whether the team services internal stakeholders or external customers. What we can say is that most teams over-alert on technical failures and under-alert on business impact — a schema change warning gets routed to Slack while a 12% revenue anomaly goes undetected because no check exists for it.
The other gap we'd flag: anomaly detection quality varies wildly across tools. Monte Carlo's ML-based detection works for some signal shapes and produces false positives for others. Elementary's anomaly detection is newer and less mature on distribution drift. None of them are substitutes for the team's actual knowledge of what should and should not happen in the business.
An alert nobody reads is noise you're paying to create.
Need help tiering alerts, tuning dbt test severity, or replacing an ignored observability stack? Talk to an engineer — we'll tell you honestly if we can help.
Frequently Asked Questions
What should you monitor in a data pipeline?
Five pillars per Monte Carlo's framework: freshness (when did this table last update), volume (did row counts change unexpectedly), schema (did columns change), quality (NULL rates, value ranges, distributions), and lineage (what downstream consumers break when a model does). Every mature setup covers all five via some combination of dbt tests, Airflow metrics, and an observability tool.
How do you avoid alert fatigue in data pipelines?
Three tiers: Page only for customer-visible incidents (under 10/month). Ticket for schema changes, non-critical freshness misses, anomalies with business impact — assigned owner, normal SLA. Dashboard for everything else, reviewed weekly. The rule: every Tier 1 alert must be actionable in under 15 minutes. Everything that fails this test goes to Tier 2 or Tier 3.
What's the difference between dbt tests and data observability tools?
dbt tests check specific assertions you define — primary key uniqueness, foreign key integrity, accepted values. They run at build time and fail loudly. Observability tools (Monte Carlo, Elementary, Soda) add anomaly detection, schema change tracking, freshness monitoring, and cross-system lineage. Use dbt tests for known invariants; use an observability tool for unknown regressions and drift.
Do you need Monte Carlo if you have Elementary?
Usually not, if the stack is dbt-centric. Elementary covers dbt-native observability — test results, anomaly detection, freshness, schema changes — at open-source cost. Monte Carlo's advantages are enterprise SSO, SLAs, and cross-system lineage including BI tools and orchestrators outside dbt. Monte Carlo's typical $100K+/year pricing makes sense for large enterprises, not mid-market dbt-heavy teams.
What Airflow metrics should you monitor?
ti_failures (task failures), dagrun.duration.success.{dag_id} (DAG runtime), scheduler.tasks.executable (scheduler backlog), pool.starving_tasks.{pool_name} (pool saturation), and dag_processing.import_errors (parse failures). Export via StatsD or OpenTelemetry, scrape with Prometheus, visualize in Grafana. These catch orchestrator health issues; data correctness requires separate dbt + observability tool monitoring.
Related posts
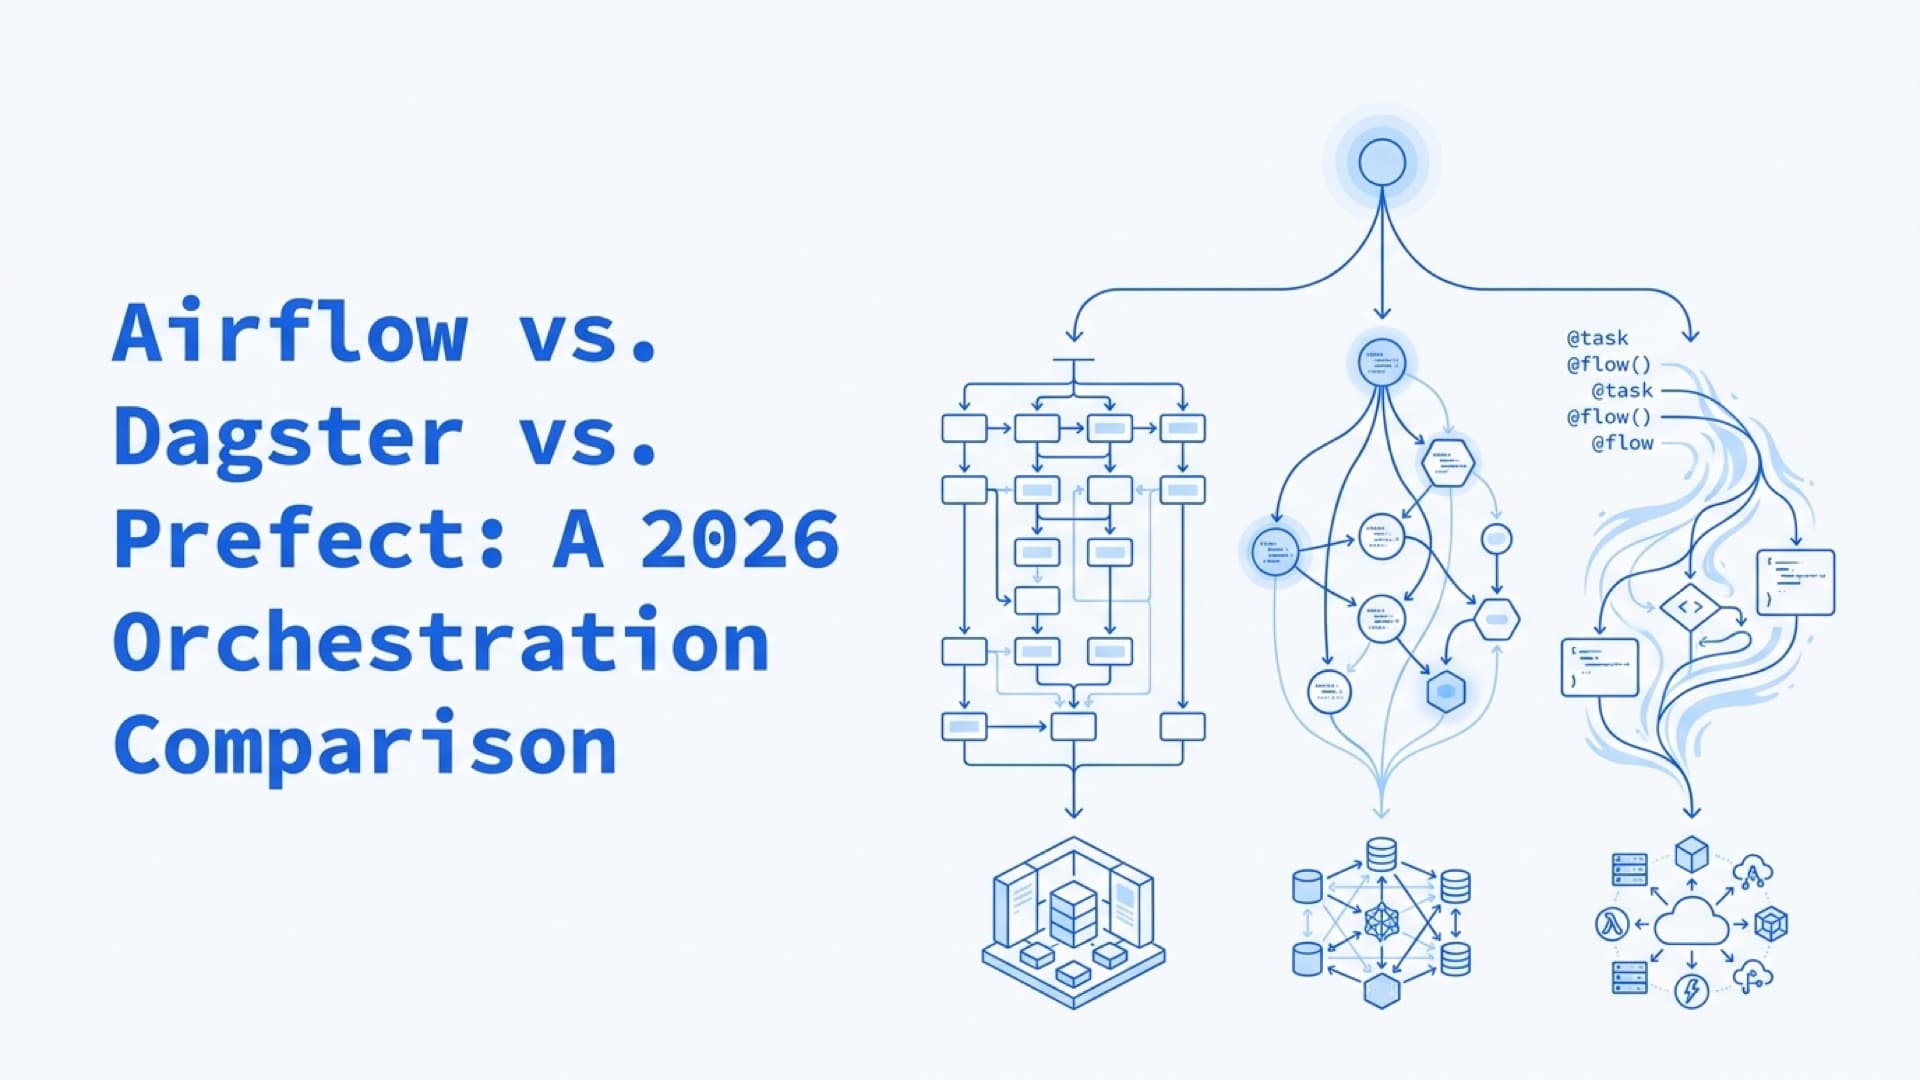
Airflow vs. Dagster vs. Prefect: A 2026 Orchestration Comparison
Airflow 3 shipped breaking changes, Dagster bet on assets over DAGs, Prefect cut 90% of runtime overhead. A decision framework based on team size, not feature lists.
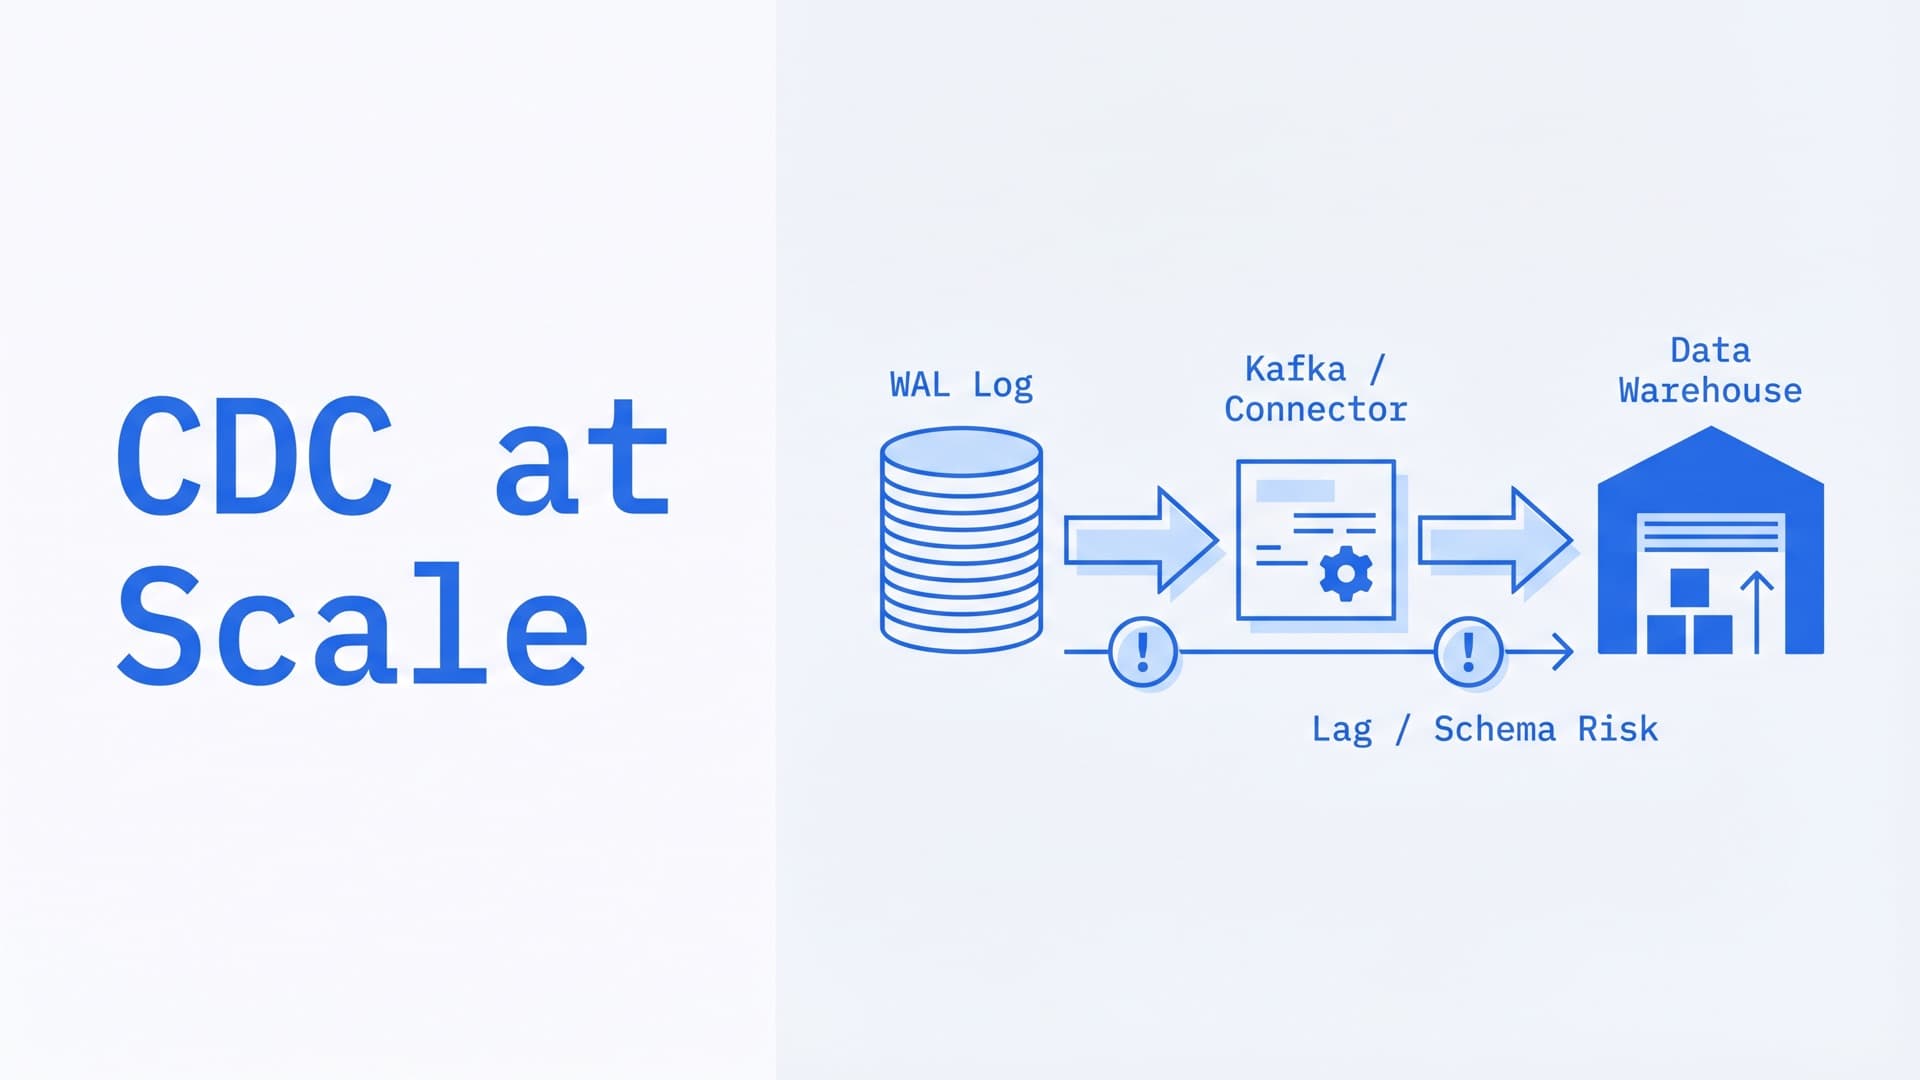
CDC at Scale: Debezium, Flink CDC, and the Real-Time Replication Problem
CDC looks simple — stream row-level changes from database to warehouse. In production it's schema drift, replication slot management, and full resyncs every time DDL runs. The honest guide.
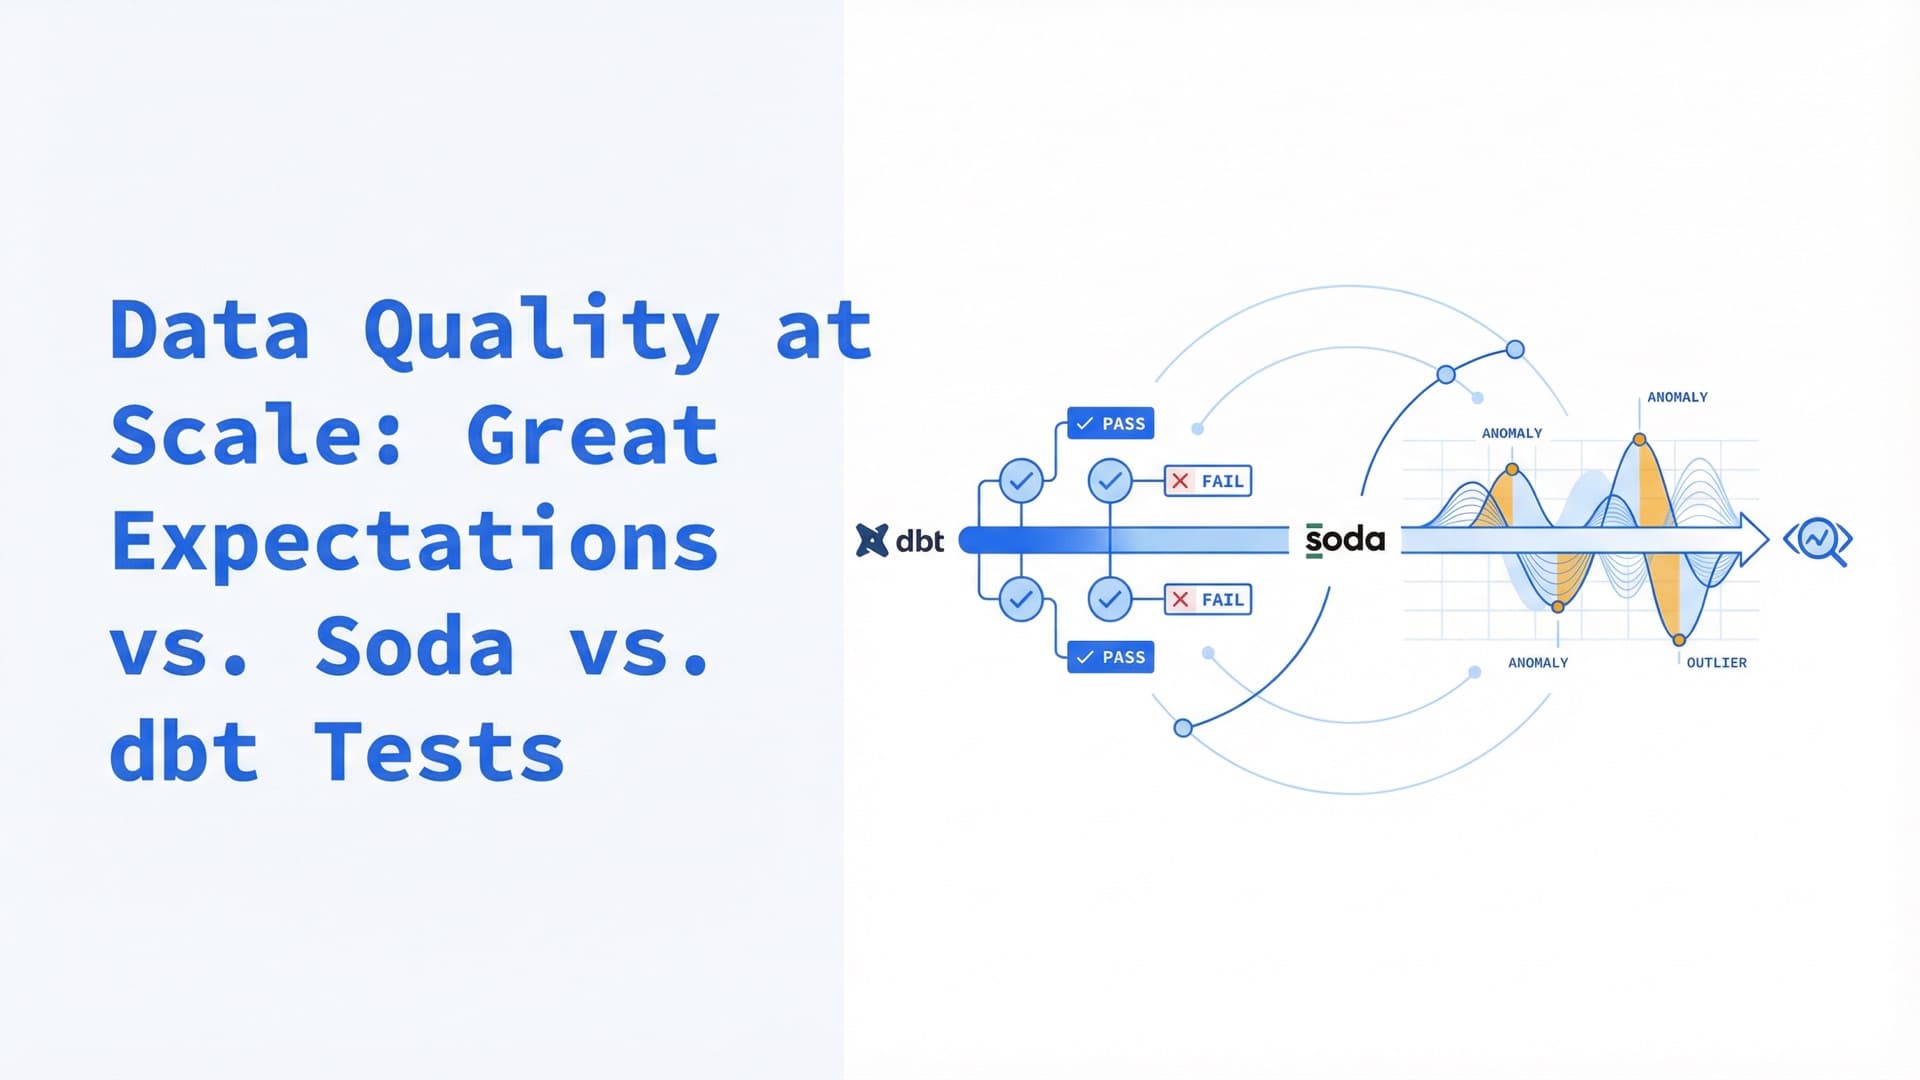
Data Quality at Scale: Great Expectations vs. Soda vs. dbt Tests
dbt tests catch transformation bugs. Great Expectations catches source corruption. Soda monitors everything between. A decision framework for choosing data quality tools in 2026.