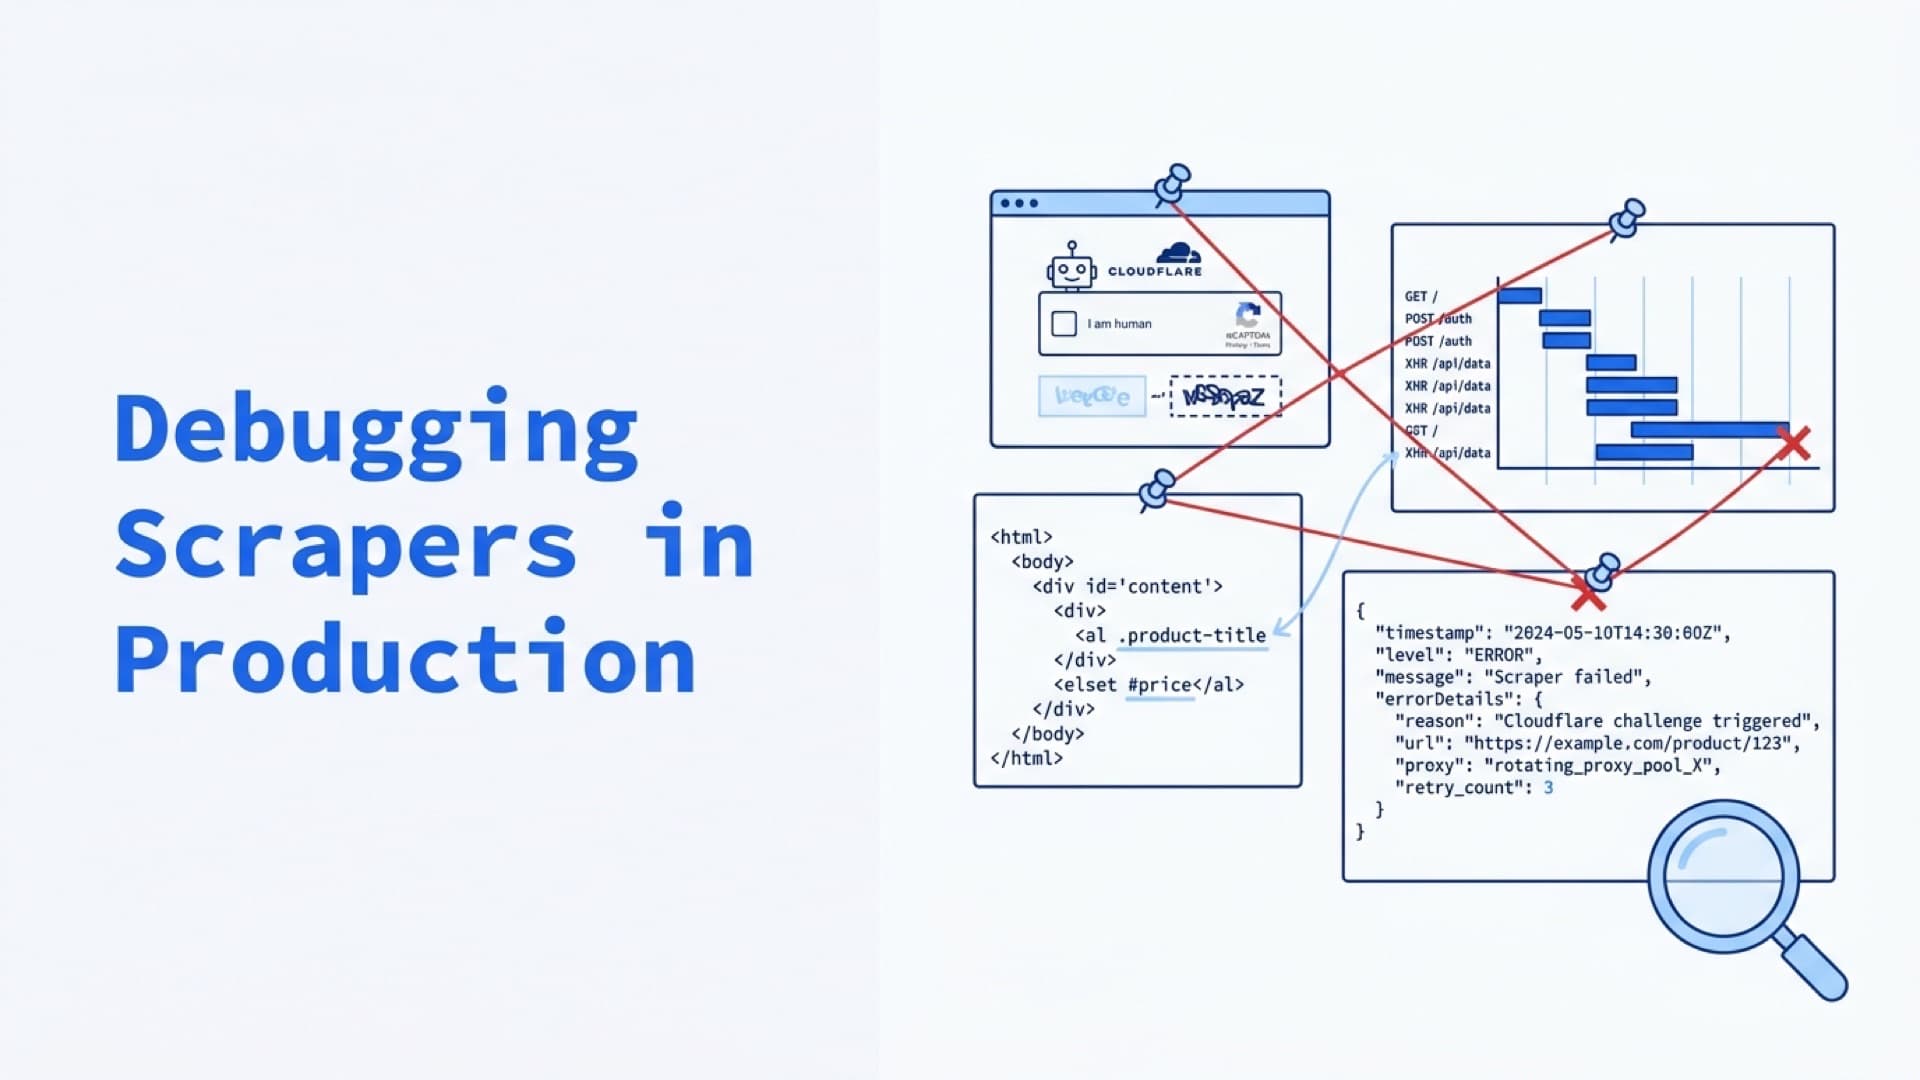
Debugging Scrapers in Production: Logs, Screenshots, Video Replay, and Failure Forensics
When we onboard a new scraping pipeline, the first audit step is always the same: page a failure, ask what evidence was captured. Most teams hand us status codes and exception types. That's enough to know something broke. It's not enough to know what.
A timeout without a screenshot is useless. A 403 without the response body is a guess. A silent Cloudflare challenge page returning 200 OK without a content hash is invisible — success metrics say the scrape worked; the pipeline has already written zero records.
The scraper that logs only status codes turns every target-side change into an hours-long investigation. The scraper with the Evidence Bundle instrumented turns it into a dashboard query. That's the whole argument.
The Evidence Bundle
Every scraper in production needs a standardized set of artifacts captured on failure — and sometimes on success, for baseline comparison. The Evidence Bundle covers four categories.
Response artifacts.
- HTTP status code
- Response headers (especially
server,cf-ray,set-cookie,content-type) - Raw response body (truncated to 50–100 KB) or S3 pointer to full body
- Content hash (SHA-256 of extracted JSON or cleaned HTML) for drift detection
Browser artifacts (for headless scraping).
- Screenshot of the rendered page at point of failure
- DOM HTML snapshot after full render (different from raw HTTP response)
- Console logs and JS errors during page load
- Network timing (DNS, TCP, TLS, first byte, full load)
Context artifacts.
- Timestamp (with microsecond precision for ordering)
- Scraper version / git SHA
- Proxy used (IP, session ID, provider)
- Worker/pod identifier
- Request chain (URL, redirects, final URL)
- Retry attempt number and classification
Extraction artifacts.
- Selectors or schema path that failed to match
- Pre-validation extracted dict
- Pydantic validation errors (if validation failed after extraction)
On failure, capture all of the above and ship to a structured log destination. On success, capture a lightweight subset (status, timing, content hash) so you have baseline data to compare against when things break.
Status code 500 is obvious. A 200 OK with wrong extraction output is the silent failure the next section addresses.
The Silent Failure Problem
HTTP status codes are a weak failure signal. Cloudflare challenge pages return 200 OK with an HTML body that looks like a page. DataDome soft blocks return 200 with a JavaScript redirect that never fires server-side. Layout changes return 200 with the old selectors hitting missing elements. All three look successful in standard monitoring. None of them produced the data you wanted.
The fix is content-validation-based success detection:
def is_scrape_successful(response, extracted) -> tuple[bool, str]:
    if response.status_code != 200:
        return False, f"http_status_{response.status_code}"
    if "challenge" in response.text[:2000].lower():
        return False, "cloudflare_challenge_detected"
    if not extracted or not extracted.get("price"):
        return False, "extraction_empty"
    if extracted.get("price", 0) <= 0:
        return False, "extraction_invalid"
    return True, "ok"
Four checks — status code, body fingerprint, extraction completeness, value sanity — each catching a different silent-failure mode.
Content hash comparison is the leading indicator of schema drift. For each target URL, store the hash of the most recent successful extraction. When the next scrape produces a hash that differs materially (distance > threshold), flag for review even if the extraction "succeeded." Small hash changes indicate content drift (new review, price update). Large hash changes usually indicate layout change. The ratio of "expected drift" to "anomalous drift" is the dashboard metric that catches layout changes before the monitoring team sees the success rate drop.
Capturing Screenshots and DOM Snapshots
For headless browser scrapers, the page itself is evidence. Playwright's Trace Viewer records screenshots, DOM snapshots, and network activity per action; it's the most complete forensics tool in the Playwright ecosystem, and the format is loadable at trace.playwright.dev.
Enabling tracing on failure only:
from playwright.async_api import async_playwright

async def scrape_with_tracing(url):
    async with async_playwright() as p:
        browser = await p.chromium.launch()
        context = await browser.new_context()
        await context.tracing.start(screenshots=True, snapshots=True, sources=True)
        page = await context.new_page()
        try:
            await page.goto(url, timeout=30000)
            data = await extract(page)
            return data
        except Exception as e:
            trace_path = f"traces/{url_hash(url)}.zip"
            await context.tracing.stop(path=trace_path)
            upload_to_s3(trace_path)
            raise
        finally:
            await browser.close()
Only save traces on failure. A full trace runs roughly 5–20 MB per scrape depending on page complexity. Capturing traces for every scrape at 100K pages/day gets you into the 1–2 TB/day range — unaffordable as hot storage. Saving only failed-scrape traces at a 3% failure rate drops that to 100–500 MB/day, which is trivial to hold in S3 for 30+ days.
Screenshot-only capture is cheaper. Every failure captures a single PNG screenshot plus the DOM HTML at the moment of failure. At 200 KB per screenshot and 100 KB per DOM dump, a 3% failure rate over 100K pages/day is ~900 MB/day — trivial to store in S3.
For Puppeteer, page.screenshot() and page.content() cover the same territory. Node.js teams typically bundle the screenshot + DOM + console log triad into a single failure report zip.
Video capture is rarely worth it. A full session recording is 10x the size of screenshots plus traces, and the information value is mostly duplicated in the trace film strip. Enable it only for specific multi-step workflow debugging (login flows, dynamic form completion) where the sequence of states matters more than any single moment.
Structured Logs: One Schema Per Scraper
The alternative to searching through unstructured stdout is a standardized log schema emitted as JSON lines. Every scraper in the fleet logs the same fields, parsable by the same dashboards.
Core fields per log record:
{
  "timestamp": "2026-04-16T14:23:45.123Z",
  "scraper_id": "amazon_product_v3",
  "scraper_version": "sha:8a3f2e",
  "url": "https://www.amazon.com/dp/B08N5WRWNW",
  "request_id": "req_01HN2X3Y4Z",
  "proxy_session": "soax_session_45678",
  "proxy_ip": "98.17.234.56",
  "attempt": 2,
  "status_code": 200,
  "content_hash": "sha256:a1b2c3...",
  "outcome": "success",
  "outcome_reason": "ok",
  "duration_ms": 1842,
  "bytes_received": 82394,
  "extracted_fields": ["title", "price", "rating"],
  "extraction_success": true
}
Ship to a searchable log store — Elasticsearch, OpenSearch, Loki, or ClickHouse with JSON ingestion — and wire Grafana or Kibana dashboards on top. One schema. Same fields across every scraper in the fleet, or the dashboards become unmaintainable.
Three dashboards that catch most issues within hours, not days:
-
Success rate by target (last 15 min, 1 hour, 24 hour windows). Catches layout changes and IP pool bans quickly. Alert threshold: per-target success rate dropping below 85% over 15 minutes.
-
Content hash drift by target (last 24 hours). Catches silent Cloudflare challenge page replacement where the status code still reads 200. Alert threshold: anomalous-drift rate above 5% of scrapes.
-
Proxy-scoped failure rate (last 1 hour). Catches contaminated proxy pools — a single proxy returning 403s on 80% of requests while others succeed. Alert threshold: any single proxy session above 50% failure rate on 20+ requests.
Proxy Debugging: The Missing Leg
Proxy-related failures are the hardest to diagnose because the failure evidence depends on which proxy hit the target at what time. Logs showing 403 on URL X tell you nothing about whether the proxy pool is contaminated, a single IP is banned, or the session rotated at the wrong moment.
Proxy evidence fields to capture per request:
- Proxy session ID (if the provider exposes one — SOAX, Bright Data, Oxylabs all do)
- Outbound IP (visible via
ipinfo.ioorhttpbin.org/ipas a sidecar check before the real request, when debugging) - Rotation event markers — did this request start a new session, or reuse an existing one?
- Per-session request count — is this IP hitting a rate limit on the target?
The debugging pattern: when 403 rates spike on a target, slice the logs by proxy_session. If failures cluster on specific sessions, the IPs are burned and rotation needs adjustment. If failures spread evenly across all sessions, the target upgraded anti-bot and the entire approach needs reconsideration.
Bright Data, Oxylabs, and SOAX all have APIs to cycle their session pools on demand. When proxy contamination is the diagnosis, triggering a pool cycle is usually faster than waiting for natural rotation. Scripting the pool cycle in response to success-rate drops — auto-remediation — is a logical extension but easy to get wrong (aggressive cycling burns budget). Alert first, automate second, after observing that the alert consistently correlates with the right fix.
Local Reproduction: The Last Mile
A failed scrape that can't be reproduced locally is stuck in "works on my machine" territory in reverse. Production scrapers hit targets with different IPs, different headers, different cookies, different proxy pools. Reproducing a failure means reconstructing that environment.
The replay pattern:
- Failed scrape's Evidence Bundle includes the full request (URL, headers, cookies, proxy session).
- Local debugging harness reads the bundle and replays the request with the same configuration.
- If the replay fails with the same symptom, the bug is reproducible — debug normally.
- If the replay succeeds, the failure is environment-specific: IP pool, session state, target rate limit, or race condition.
Target state drifts over time. A trace captured at 14:00 UTC may not reproduce at 18:00 UTC because the target updated its content, fired a new anti-bot rule, or cycled sessions on its own side. Plan for the replay window to close within hours. If a failure isn't reproducible by end of the same day, the forensic trail is usually cold.
Tools that help: mitmproxy captures the exact HTTP request/response round-trip for later replay. Playwright's context.routeFromHAR() replays recorded network traffic against a script. Chrome DevTools' .har export gives you the captured network log for manual inspection.
Need help instrumenting scraper observability? Talk to an engineer — we design log schemas, Evidence Bundle capture, and monitoring dashboards for production scraping pipelines.
What This Framework Cannot Tell You
Whether a captured failure will reproduce after the target changes state. Replay windows close fast on aggressive targets — a Cloudflare challenge captured at 10 a.m. may not fire the same way by 2 p.m. because the ML model updated based on intervening traffic. Forensics tell you what happened. They don't always tell you how to make it happen again.
Monitoring coverage is the harder question. Every new failure class that surfaces teaches you about a signal you weren't watching: proxy contamination that evaded your alerts because no dashboard sliced by proxy session, silent schema drift that hid because the hash threshold was too loose, cookie-state races that only show up once per thousand scrapes. The first instance of each failure class is always undetected. What matters is whether the second instance hits the monitoring you added after the first.
Capture the evidence on failure, not after it.
Frequently Asked Questions
How do I debug a web scraper that's failing intermittently?
Capture an Evidence Bundle on every failure: HTTP response with headers and truncated body, browser screenshot, DOM HTML snapshot, Playwright trace (if using headless browsers), and structured context logs (timestamp, proxy session, scraper version, retry attempt). Ship to S3 or a log store. Without these artifacts, reproducing intermittent failures takes hours per incident; with them, it takes minutes.
What should I log in a production web scraper?
Emit structured JSON logs with a standard schema: timestamp, scraper ID and version, URL, request ID, proxy session and IP, attempt number, HTTP status, content hash, outcome classification, duration, extraction success. Ship to Elasticsearch, OpenSearch, Loki, or ClickHouse. Build dashboards for success rate per target (15m window), content hash drift (24h), and proxy-scoped failure rate (1h).
How do I detect silent scraper failures that return 200 OK?
Use content-validation-based success detection, not HTTP status alone. Check the response body for challenge page fingerprints ("challenge" keywords, Cloudflare HTML patterns), validate that extraction produced non-null required fields, and compare the content hash against the previous successful scrape's hash. A scrape returning 200 with empty extraction, a challenge page body, or a drastically different hash is a silent failure.
When should I enable Playwright's trace viewer for production scraping?
Enable tracing only on failure to avoid storage blowup. A full trace averages 5–20 MB per scrape; capturing all traces at 100K pages/day produces 1–2 TB/day. With context.tracing.start() in the try block and tracing.stop(path=...) in the except block, you capture traces only for the 2–5% of scrapes that fail, cutting storage to ~100 MB/day and keeping production-grade forensics affordable.
How do I capture screenshots on Playwright scraper failures?
Wrap scraping logic in try/except and call await page.screenshot(path=...) plus await page.content() in the except block. Upload both artifacts plus the exception message to S3 with the scraper run ID. At 200–300 KB per screenshot and 100 KB per DOM dump, a 3% failure rate at 100K pages/day produces ~900 MB/day of failure artifacts — small enough to keep in hot storage for 30+ days.
Related posts
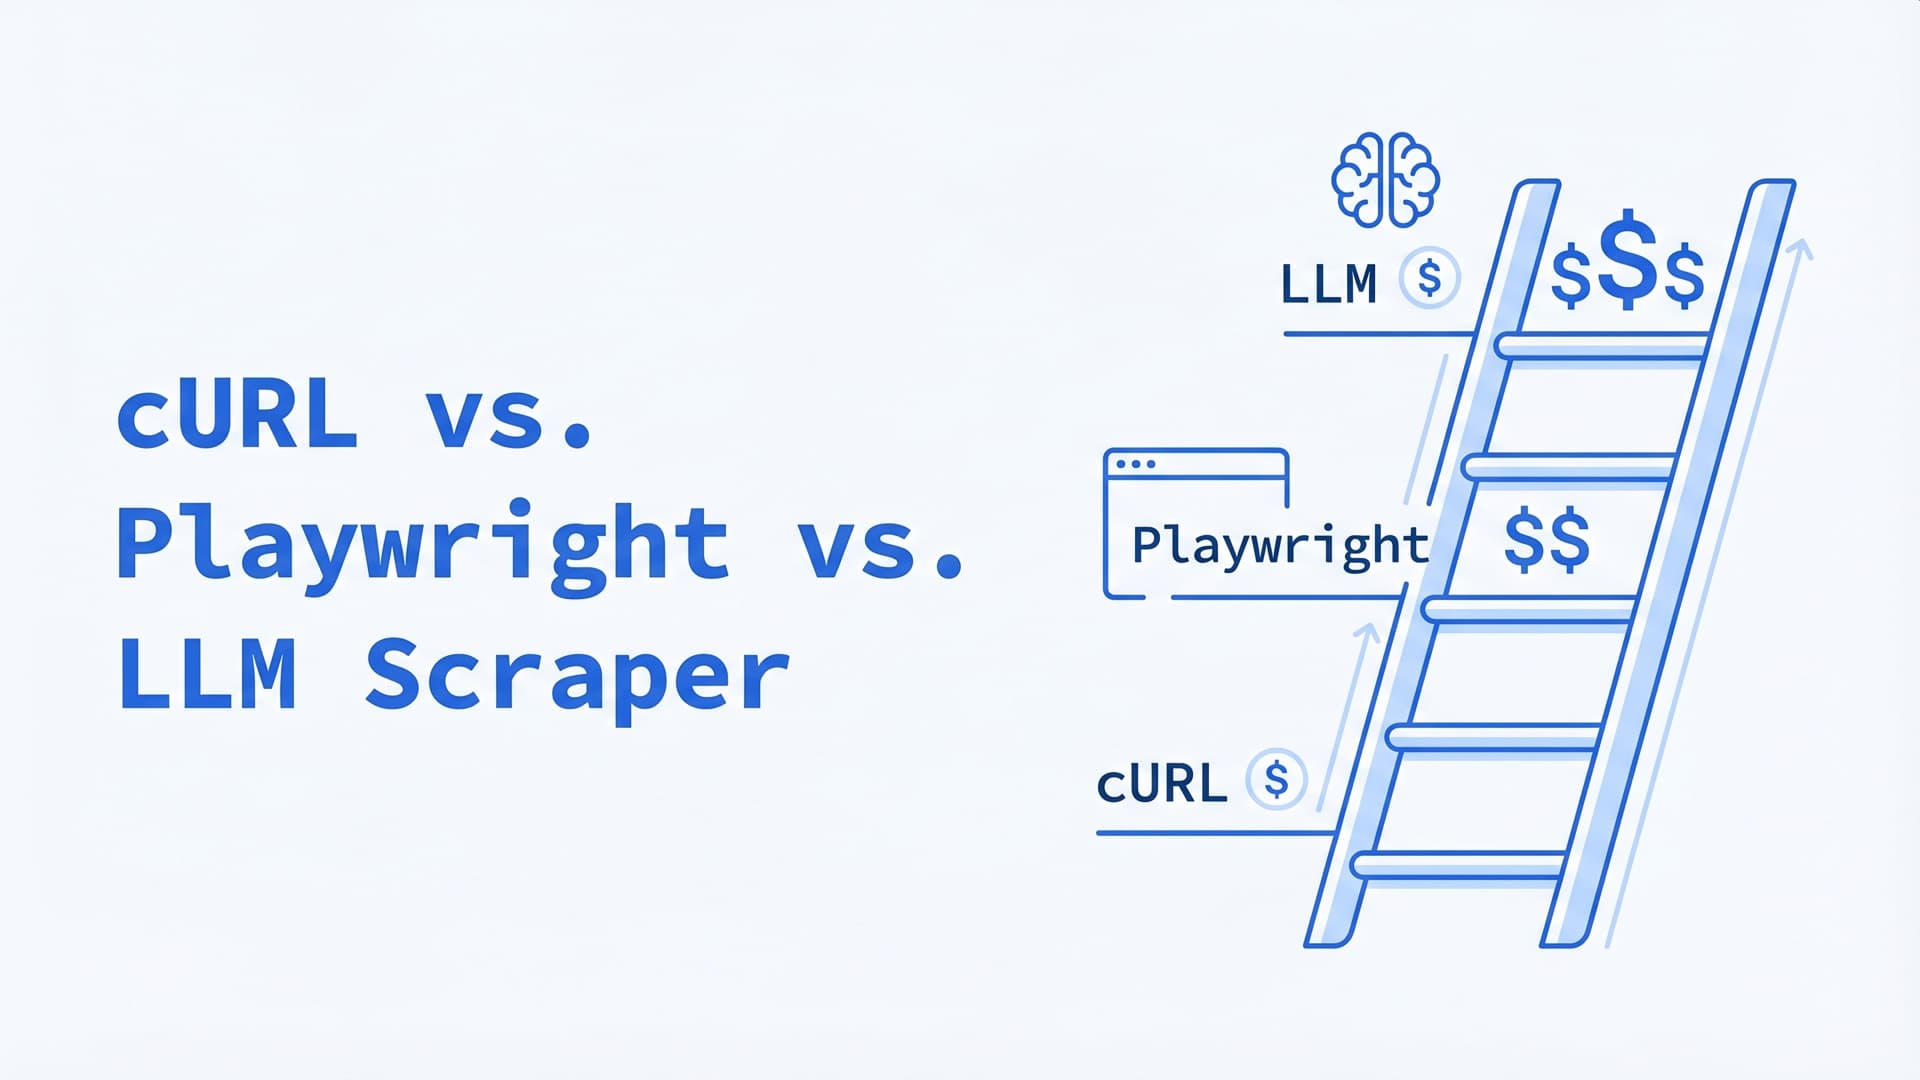
cURL vs. Playwright vs. LLM Scraper: A Decision Tree for 2026
Same scraping job costs $5, $150, or $6,000/month depending on the tool you pick. A 4-step decision tree for choosing between HTTP clients, headless browsers, and LLM-native scrapers in production.
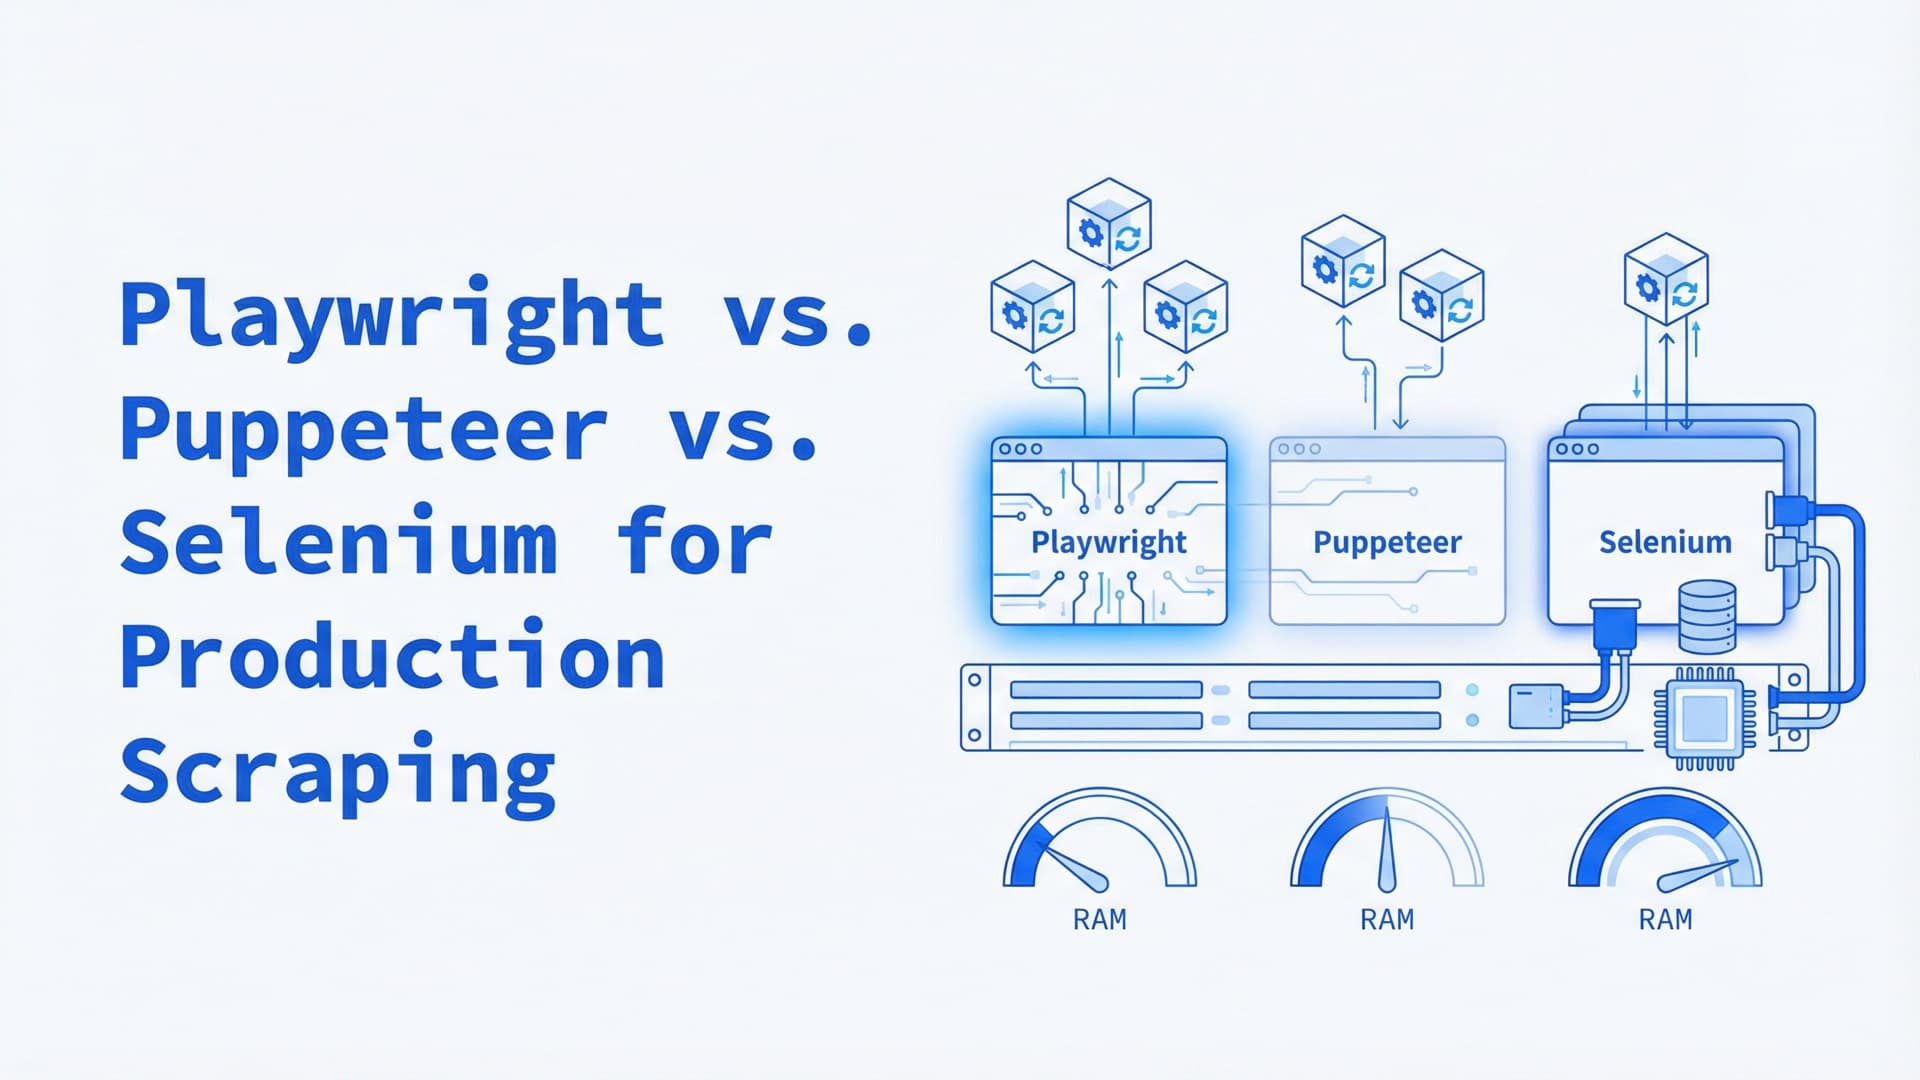
Playwright vs. Puppeteer vs. Selenium for Production Scraping: A 2026 Comparison
Most headless browser comparisons test on localhost. Production scraping at 100+ concurrent sessions reveals different winners — here's the data on memory, detection, and Kubernetes deployment.
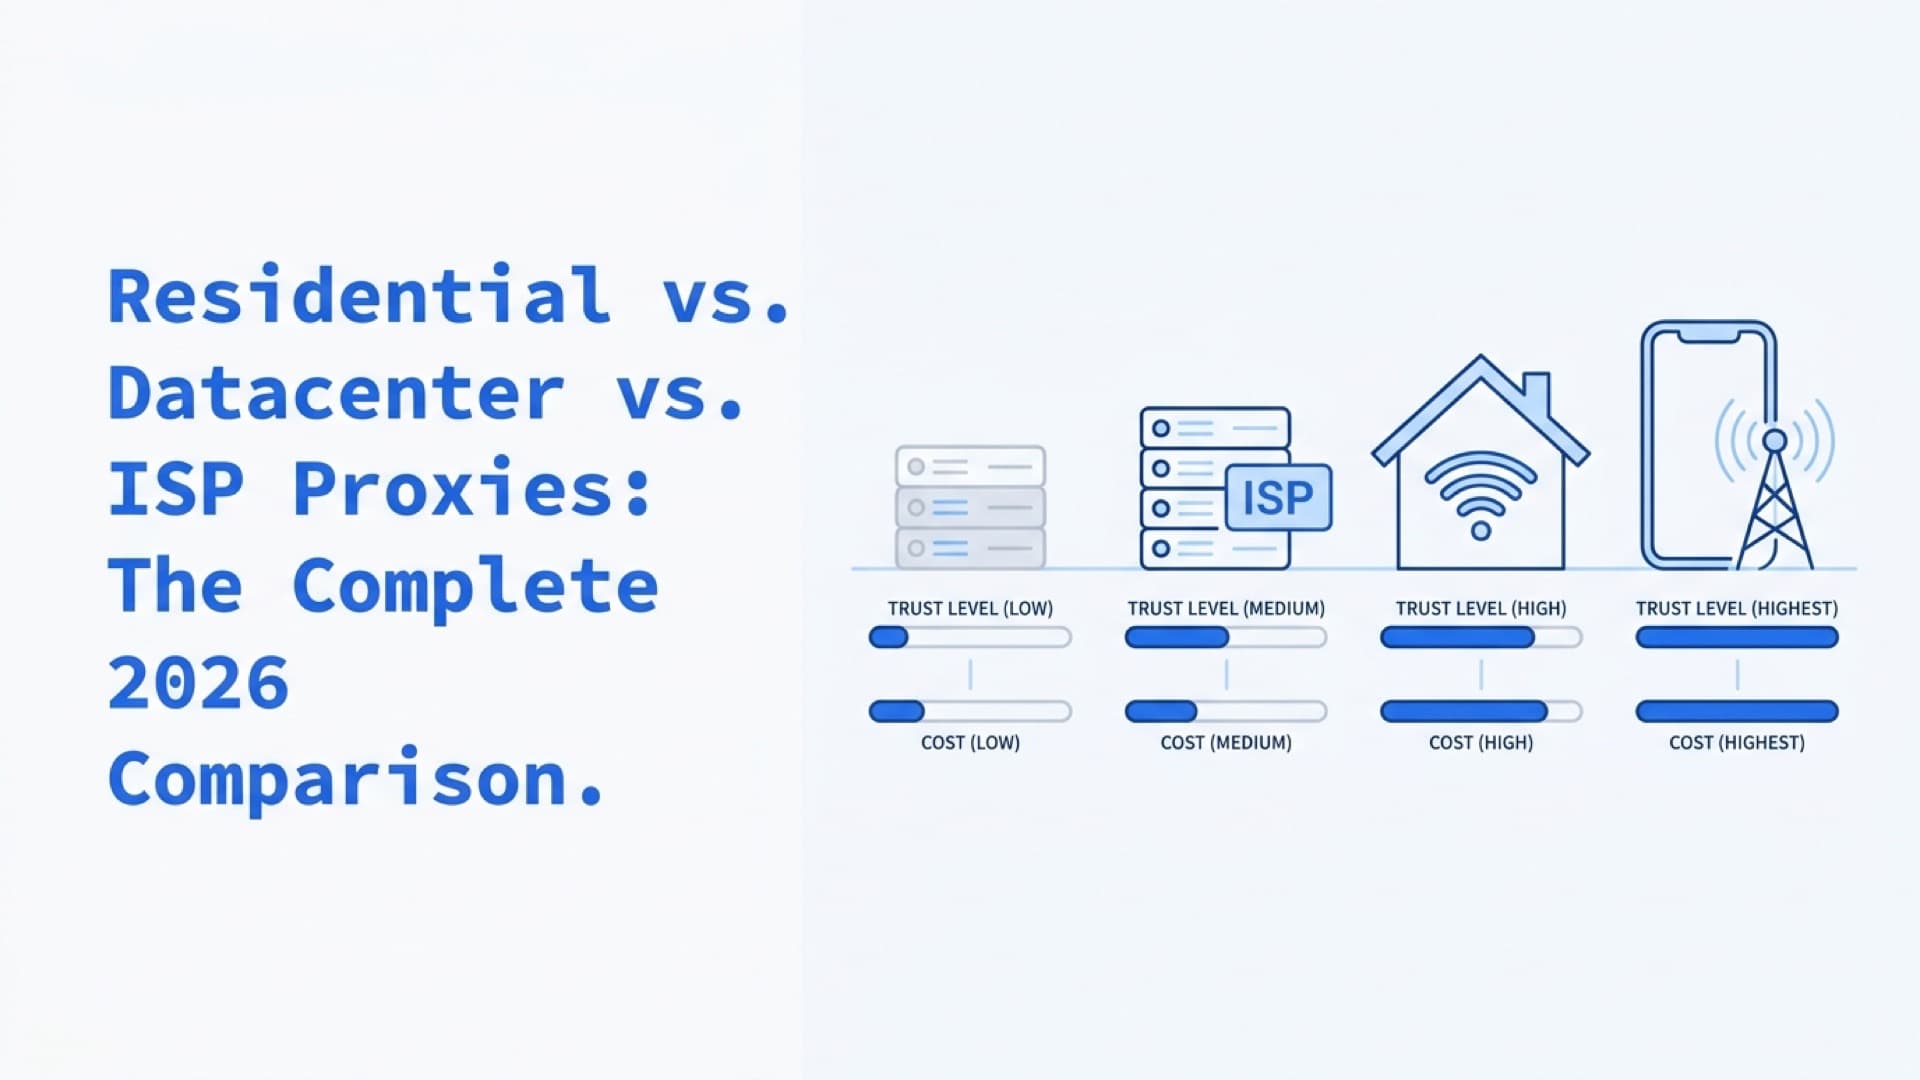
Residential vs. Datacenter vs. ISP Proxies: The Complete 2026 Comparison
Datacenter proxies hit 59.80% success on protected targets. Residential hit 94.30%. ISP proxies land at 89.34% with datacenter speed. Here's when each type wins and what it actually costs per successful request.