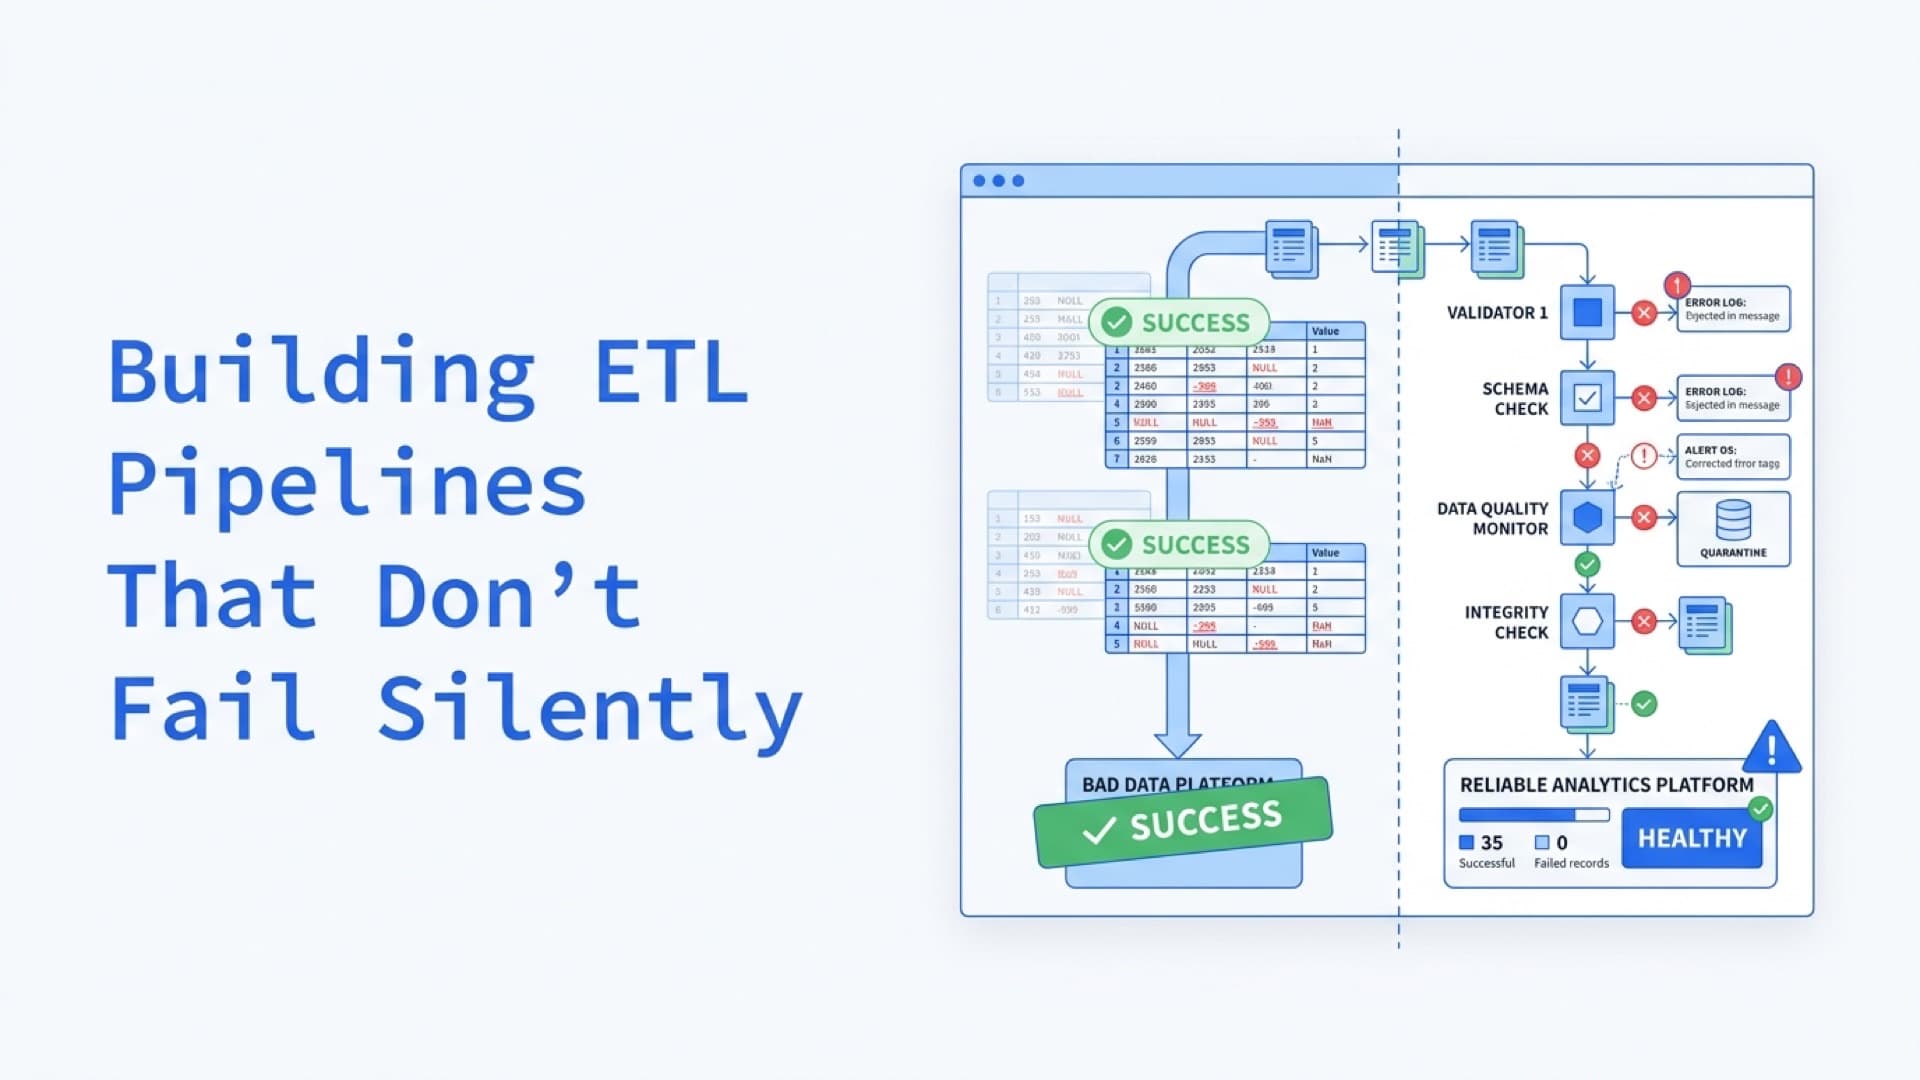
Building ETL Pipelines That Don't Fail Silently
The data pipeline that wakes you up at 3 AM is not the dangerous one. You know it broke, you fix it, you go back to sleep. The dangerous one ran successfully last night — green status, no alerts, data loaded on schedule — and it's been loading wrong data into your warehouse for six weeks. Nobody knows yet.
We build and operate data pipelines for clients across search infrastructure, social media indexing, and analytics platforms. The pattern we see most often when inheriting an existing stack is not broken pipelines — it's pipelines that appear healthy but aren't. Every orchestrator shows green. Every sync reports complete. The data is wrong.
Uber documented this at scale: 90% of their 20,000 critical pipelines had no unit tests. Not because their 3,000+ engineers were careless — because the ETL tooling made testing an afterthought. They eventually built Sparkle to enforce it, delivering a 30% productivity improvement. But the underlying problem isn't unique to hyperscale. It's the default state of most data infrastructure.
There's a name for this: the Phantom Green. Your orchestrator shows all tasks succeeded. Your scheduler reports on time. Your dashboard is a wall of green checkmarks. And somewhere downstream, a finance team is making quarterly decisions on data that drifted from reality weeks ago.
Gartner estimates that poor data quality — often stemming from exactly this kind of silent pipeline failure — drains organizations of $12.9 million annually on average. Not from crashes. From corruption nobody caught.
Why ETL Pipelines Fail Silently
Airflow checks exit codes. Fivetran checks sync status. dbt checks whether models compiled. None of them check whether the data that came out the other side is actually correct. The system reports success when no exception is thrown — but "no exception" and "correct data" are different things entirely.
Five failure modes that produce a Phantom Green:
1. Schema drift without validation
A source API renames customer_id to cust_id. The pipeline still runs — it just maps the old column to NULL or drops it entirely. No error. No alert. Every downstream join that depended on customer_id now produces empty results or silent mismatches.
This is the most common Phantom Green. Airbyte's analysis of ETL pitfalls identifies schema changes as "one of the most common pipeline failure modes" — and the most dangerous precisely because they don't cause immediate failures. A Salesforce admin renames a field. A vendor updates their API from v2 to v3 and deprecates three columns. A database migration changes INTEGER to BIGINT. In each case, the ingestion layer keeps running. The data keeps flowing. It's wrong in ways that won't surface until someone notices that last Tuesday's revenue report doesn't reconcile.
2. Partial load masquerading as complete
An API rate limit kicks in mid-extraction. The pipeline loads 80% of the records and marks the task as complete because no exception was thrown. The missing 20% doesn't trigger an alert because the pipeline has no concept of expected record count.
This is particularly insidious with paginated API sources. If the source returns 10 pages yesterday and 8 pages today because of a timeout on pages 9 and 10, the ingestion framework reports success on all 8 pages it received. The system doesn't know what it doesn't know.
3. Type coercion hiding data loss
A decimal field arrives as a string. The transformation layer casts it silently, truncating "99.999" to 99 or interpreting "N/A" as 0. No exception — the cast succeeded. The data is now wrong in a way that's statistically invisible unless someone runs a distribution check.
4. Timezone misalignment
Source system timestamps in UTC. Pipeline assumes local time. Every event shifts by 5-8 hours depending on DST. The daily totals still reconcile — the errors cancel out in aggregate — so nobody catches it until someone drills into hourly revenue and the numbers make no sense.
5. Stale data from failed incremental logic
A pipeline uses WHERE updated_at > last_run_timestamp to extract only new records. The source system backfills historical records with a new updated_at but within a window the pipeline already processed. Those records never get picked up again. The warehouse shows data from the initial load, permanently missing the corrections.
Maxime Beauchemin — the creator of Apache Airflow — described this exact problem in his Functional Data Engineering framework: partitions that depend on previous partitions create "growing complexity linearly over time." The incremental approach trades correctness for speed, and most teams don't realize the trade-off until the data is already wrong.
The Observability-First Design Principle
When we design pipelines for clients, observability isn't a phase that happens after the build. It's part of the architecture from the first DAG — the pipeline verifying its own output at every stage, not just reporting whether the job finished.
Monte Carlo — the data observability platform used by CNN, JetBlue, and 150+ enterprises — defines five pillars of data observability: freshness, quality, volume, schema, and lineage. According to their industry analysis, the average time-to-detection for a data incident is 4 hours. Time-to-resolution: 9 hours. Thirteen hours of corrupt data flowing downstream before anyone acts.
Layer 1: Schema contracts at the boundary
Before data enters your pipeline, validate it against an explicit schema contract. Not after transformation — at the point of extraction.
# Great Expectations: define schema contract for source data
validator.expect_column_to_exist("customer_id")
validator.expect_column_values_to_be_of_type("customer_id", "INTEGER")
validator.expect_column_values_to_not_be_null("customer_id")
validator.expect_column_values_to_be_unique("customer_id")
Great Expectations is the most widely adopted open-source framework for this. Define Expectation suites as code, run them as Checkpoints within your pipeline, and generate human-readable Data Docs as validation reports. The critical design choice: these contracts run before the load step, not after. If the contract fails, the pipeline halts before corrupt data reaches the warehouse.
For teams already running dbt, the built-in test framework covers the transformation layer:
# dbt schema.yml: tests that run with every dbt build
models:
  - name: orders
    columns:
      - name: order_id
        tests:
          - unique
          - not_null
      - name: total_amount
        tests:
          - not_null
          - dbt_utils.accepted_range:
              min_value: 0
              max_value: 1000000
The gap between Great Expectations and dbt tests maps to pipeline stages. Great Expectations validates raw source data at extraction. dbt tests validate transformed data in the warehouse. Cover both, and schema drift has nowhere to hide.
Layer 2: Volume anomaly detection
Record counts are crude but effective. Compare today's load against a rolling average. A 20% drop in daily row count isn't definitive proof of failure — but it's a signal worth investigating before the data reaches dashboards.
-- dbt test: flag if today's load is <80% of 7-day average
SELECT count(*) as row_count
FROM {{ ref('stg_orders') }}
WHERE loaded_at = CURRENT_DATE
HAVING count(*) < (
  SELECT AVG(daily_count) * 0.8
  FROM (
    SELECT DATE(loaded_at) as dt, count(*) as daily_count
    FROM {{ ref('stg_orders') }}
    WHERE loaded_at >= CURRENT_DATE - INTERVAL '7 days'
    GROUP BY 1
  )
)
Soda offers a declarative approach with SodaCL — a YAML-based checks language with 50+ built-in metrics. Free tier covers 3 datasets. The checks run against your warehouse directly:
# SodaCL: volume and freshness checks
checks for stg_orders:
  - row_count > 0
  - freshness(loaded_at) < 2h
  - duplicate_count(order_id) = 0
  - missing_percent(customer_id) < 1%
Layer 3: Distribution monitoring
Volume catches gross failures. Distribution monitoring catches subtle ones — the type coercion that turns "N/A" into 0, the timezone drift that shifts events by hours, the backfill that overwrites corrected records with stale data.
The approach: track statistical distributions of key columns over time. If revenue_per_order suddenly shifts from a mean of $85 to $42, something changed upstream. This isn't a test you write once — it's a monitoring layer that learns baseline distributions and alerts on deviation.
Monte Carlo does this with ML-based anomaly detection across all five observability pillars. Enterprise pricing starts above $100K/year. For teams that can't justify that spend, Elementary provides dbt-native observability as an open-source alternative — it reads dbt artifacts and generates reports with anomaly detection on test results, model runs, and data quality metrics.
Layer 4: Lineage for blast radius
When a data incident does happen, the first question is: what's affected? Without lineage, answering that question requires manual investigation across every downstream model, dashboard, and report.
OpenLineage provides the open standard — a JSON Schema-based spec for capturing lineage events across Airflow, dbt, Spark, and Flink. Dagster builds lineage natively through its software-defined asset model. For teams on Airflow + dbt, integrating OpenLineage with both tools gives you column-level lineage from source to dashboard.
The operational payoff: when that API renames customer_id, lineage tells you which downstream models, dashboards, and ML features are affected — in seconds, not hours. A mid-sized dbt project might have 50+ models, a dozen dashboards, and several ML pipelines consuming warehouse data. Without lineage, triaging that blast radius is a manual investigation. With it, you have a fix list before the Slack thread starts.
Building the Pipeline: Functional Principles That Prevent Silent Failures
Observability catches problems after they occur. Functional pipeline design prevents them from occurring. We apply Beauchemin's Functional Data Engineering paradigm as the architectural foundation — three principles that directly attack the Phantom Green:
Idempotent tasks. Every task, when rerun with the same inputs, produces identical outputs. This means full partition overwrites instead of append-only loads. If a pipeline fails mid-run and you restart it, you get the correct result — not a duplicated partial result on top of a corrupted partial result.
Immutable staging. Raw data lands in a persistent, untransformed staging area and stays there permanently. If your transformation logic changes, you can recompute the entire warehouse from the immutable source. This eliminates the class of bugs where a transformation error permanently corrupts data because the original source was overwritten.
Partition isolation. Each partition (typically a date partition) is self-contained — it doesn't depend on the output of previous partitions. This makes backfills parallelizable and eliminates the creeping complexity of incremental logic that Beauchemin warns about.
In practice, this means we default to full-refresh models in dbt for anything where correctness matters more than speed. Incremental models earn their place only when they come with explicit validation proving the incremental logic didn't miss records.
# dbt: incremental model with explicit validation
{{ config(
    materialized='incremental',
    unique_key='order_id',
    on_schema_change='fail'  # halt if source schema changes
) }}

SELECT *
FROM {{ source('raw', 'orders') }}
{% if is_incremental() %}
WHERE updated_at > (SELECT max(updated_at) FROM {{ this }})
{% endif %}
The on_schema_change='fail' flag is critical. Without it, dbt silently ignores new or renamed columns in the source — exactly the kind of Phantom Green that corrupts data without raising an alert.
What Teams Actually Get Wrong
The State of Airflow 2026 survey of 5,800+ data professionals across 122 countries found that dbt is paired with Airflow at a 44% adoption rate. But pairing dbt with Airflow doesn't automatically mean the pipeline is observable. The most common implementation pattern is still: Airflow triggers a dbt run, dbt runs models and tests, Airflow marks the task as success if dbt exits 0.
The problem: dbt tests run after transformation. If 3 out of 200 tests fail but dbt is configured with --warn-error-as-failure off (the default behavior for many teams), the run still exits 0. Airflow sees a green task, marks the DAG successful, and moves on. Another Phantom Green, running in production.
The fix is explicit: configure dbt to fail on warnings, configure Airflow to check dbt test results as a separate task (not just the exit code of dbt run), and add a validation gate between staging and production that blocks promotion if any data quality check fails.
According to Airbyte's analysis of ETL pipeline pitfalls, teams spend 60-80% of their time maintaining fragile systems instead of delivering business value. The bulk of that maintenance is reactive — investigating data incidents after they've already reached dashboards. Each of the four observability layers above exists to shift that work from reactive to preventive: catch the problem at ingestion, not in a Slack thread from the finance team three weeks later.
Where This Stops Working
Everything above assumes you can define what correct data looks like. For pipelines built on internal databases, APIs with documented schemas, warehouse-to-warehouse transfers — that's straightforward. We define the schema contract, we set the volume thresholds, we know what the distribution should look like.
Third-party data sources are different. We don't have a good preventive answer for undocumented API changes — schema contracts catch them after the fact. The best defense we've found is aggressive freshness monitoring combined with distribution checks: you won't know what changed, but you'll catch it fast enough to limit the blast radius.
Gartner projects that 50% of enterprises with distributed data architectures will adopt data observability tools by 2026, up from roughly 20% in 2024. The economics are simple: the cost of building observability into your pipelines is measurable and upfront. The cost of not building it — $12.9 million annually in data quality losses, according to Gartner — accumulates invisibly until someone audits last quarter's numbers.
A green dashboard is not a healthy pipeline. It's an untested assumption.
Need help building observable data pipelines? Talk to an engineer — we'll tell you honestly if we can help.
Frequently Asked Questions
What is silent failure in an ETL pipeline?
Silent failure occurs when a pipeline completes without errors but produces incorrect data. Common causes include schema drift, partial loads from API timeouts, type coercion that hides data loss, and timezone misalignment. The pipeline reports success while downstream analytics operate on corrupted data — sometimes for weeks before detection.
How do you test ETL pipelines in production?
Use a layered approach: schema contracts via Great Expectations at the extraction boundary, dbt tests on transformed data in the warehouse, volume anomaly detection comparing daily loads against rolling averages, and distribution monitoring on key business metrics. Run tests as pipeline stages, not as separate batch jobs.
What is the difference between Great Expectations and dbt tests?
Great Expectations validates raw source data at the point of extraction — before it enters your warehouse. dbt tests validate transformed data after models run. They cover different pipeline stages: Great Expectations catches schema drift and source-side corruption, while dbt tests catch transformation logic errors and referential integrity failures. Use both.
How much does data pipeline monitoring cost?
Open-source tools like Great Expectations, Soda Core, and Elementary are free. Soda Cloud starts at $8/dataset/month for team features. Monte Carlo, the enterprise data observability platform, starts above $100K/year. For most mid-market teams, a combination of dbt tests, Soda Core, and Elementary provides production-grade observability at minimal cost.
What are the five pillars of data observability?
Monte Carlo defines five pillars: freshness (how current your data is), quality (accuracy metrics like NULL rates and uniqueness), volume (completeness of data loads), schema (structural changes to tables), and lineage (upstream sources and downstream dependencies). Monitoring all five pillars reduces the industry-average 4-hour detection time for data incidents to near-zero.
Related posts
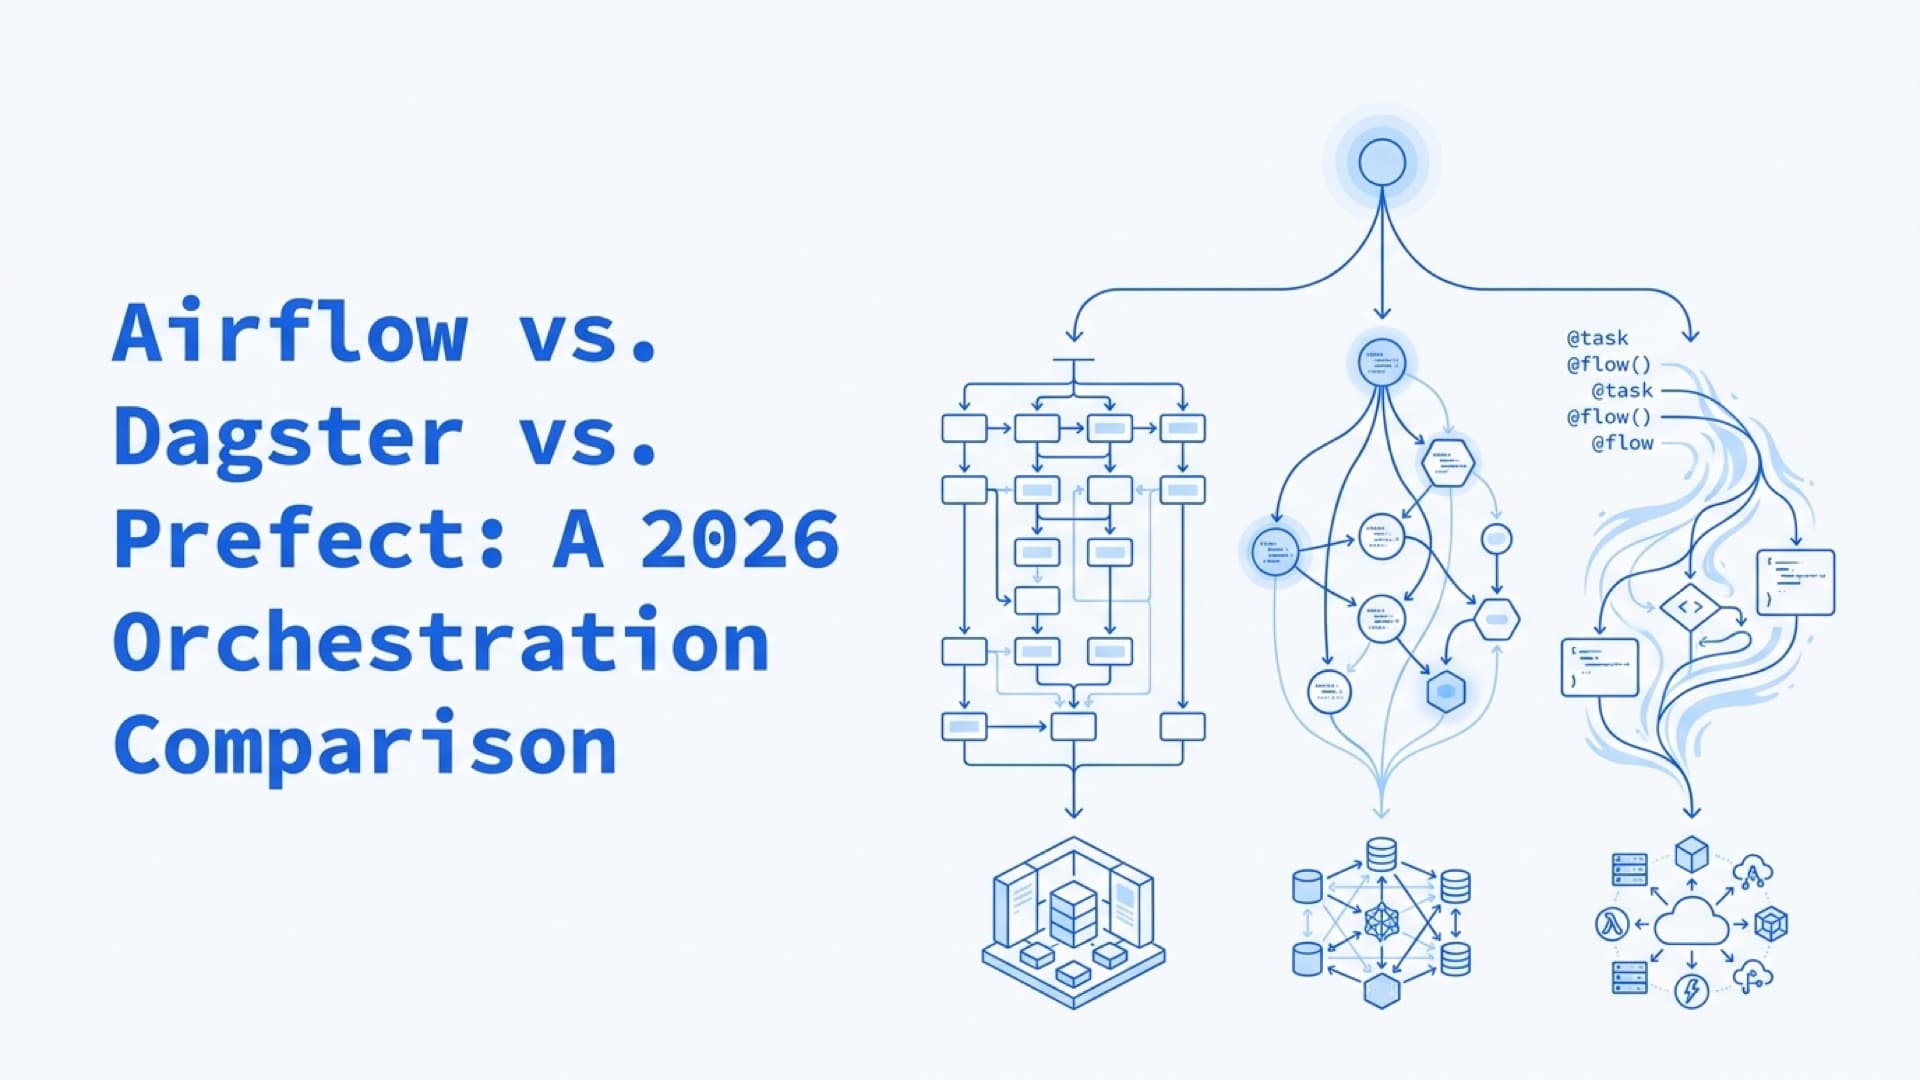
Airflow vs. Dagster vs. Prefect: A 2026 Orchestration Comparison
Airflow 3 shipped breaking changes, Dagster bet on assets over DAGs, Prefect cut 90% of runtime overhead. A decision framework based on team size, not feature lists.
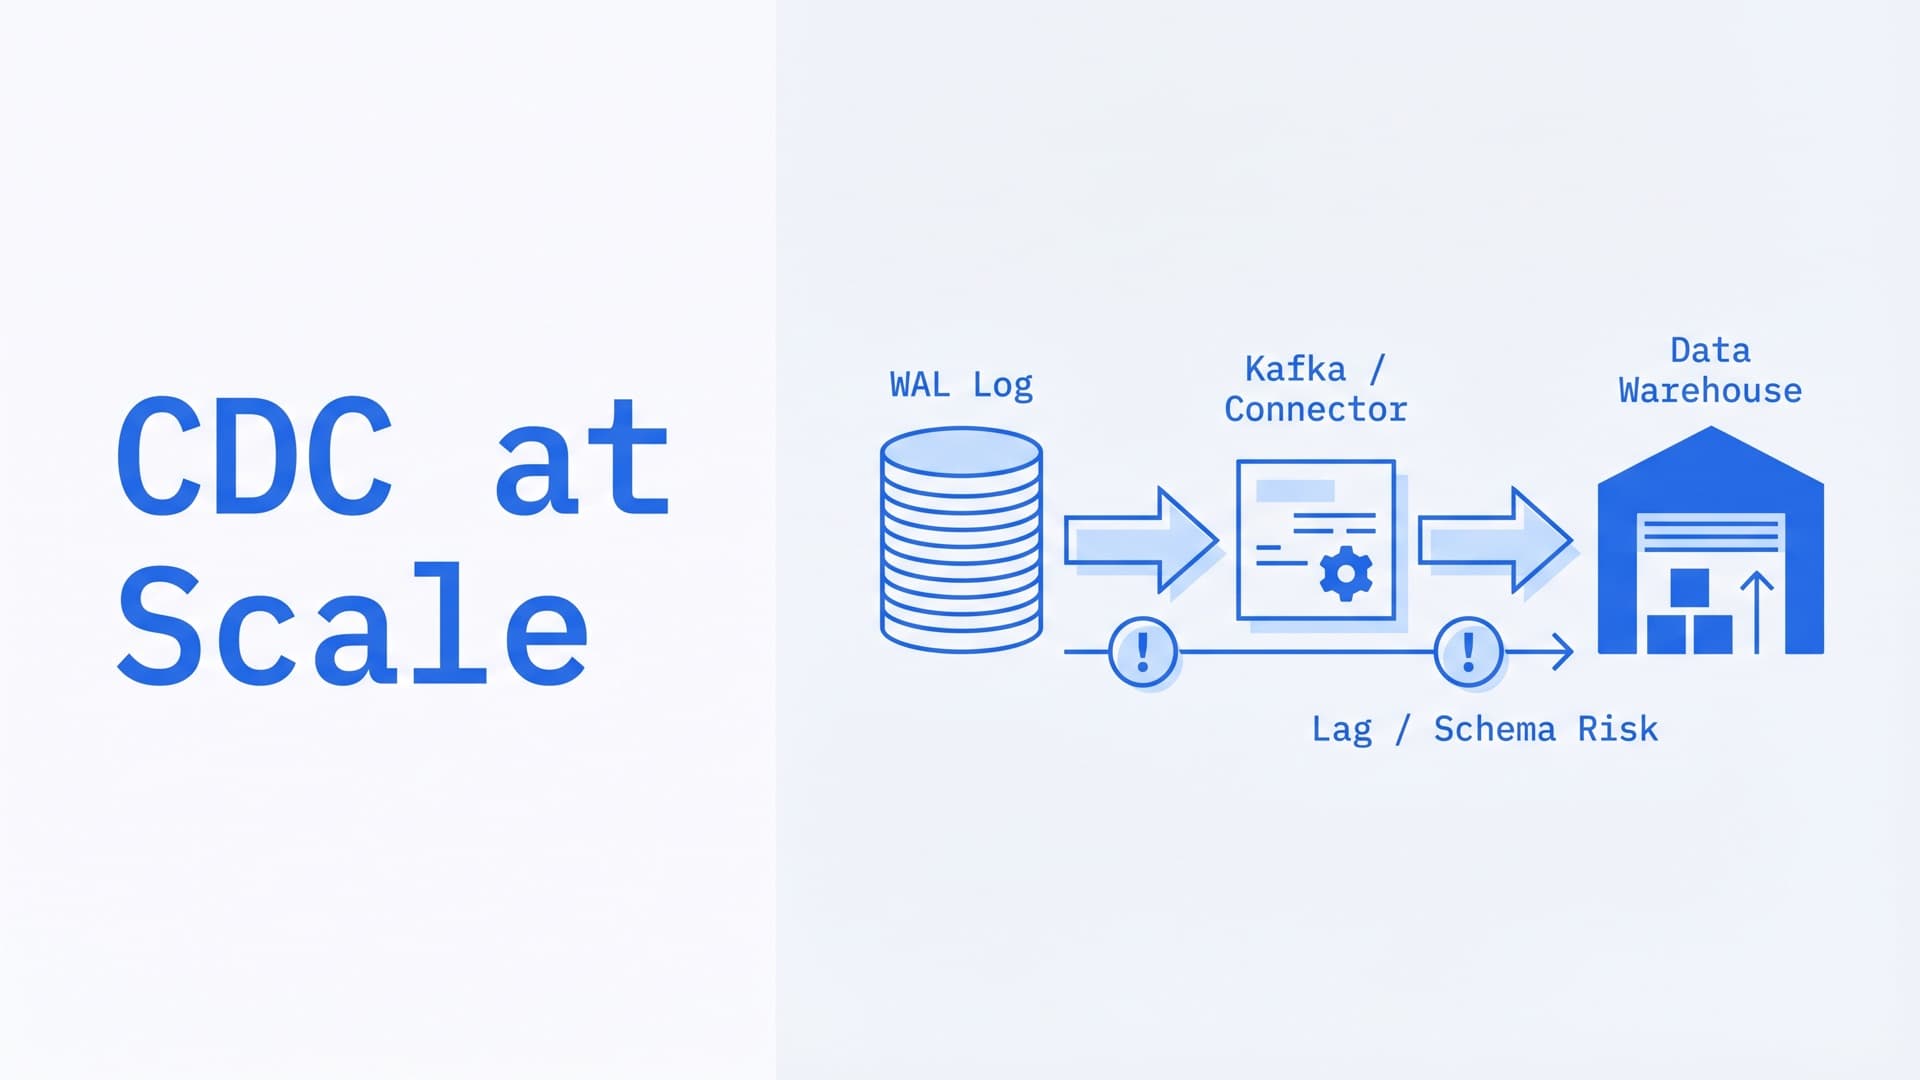
CDC at Scale: Debezium, Flink CDC, and the Real-Time Replication Problem
CDC looks simple — stream row-level changes from database to warehouse. In production it's schema drift, replication slot management, and full resyncs every time DDL runs. The honest guide.
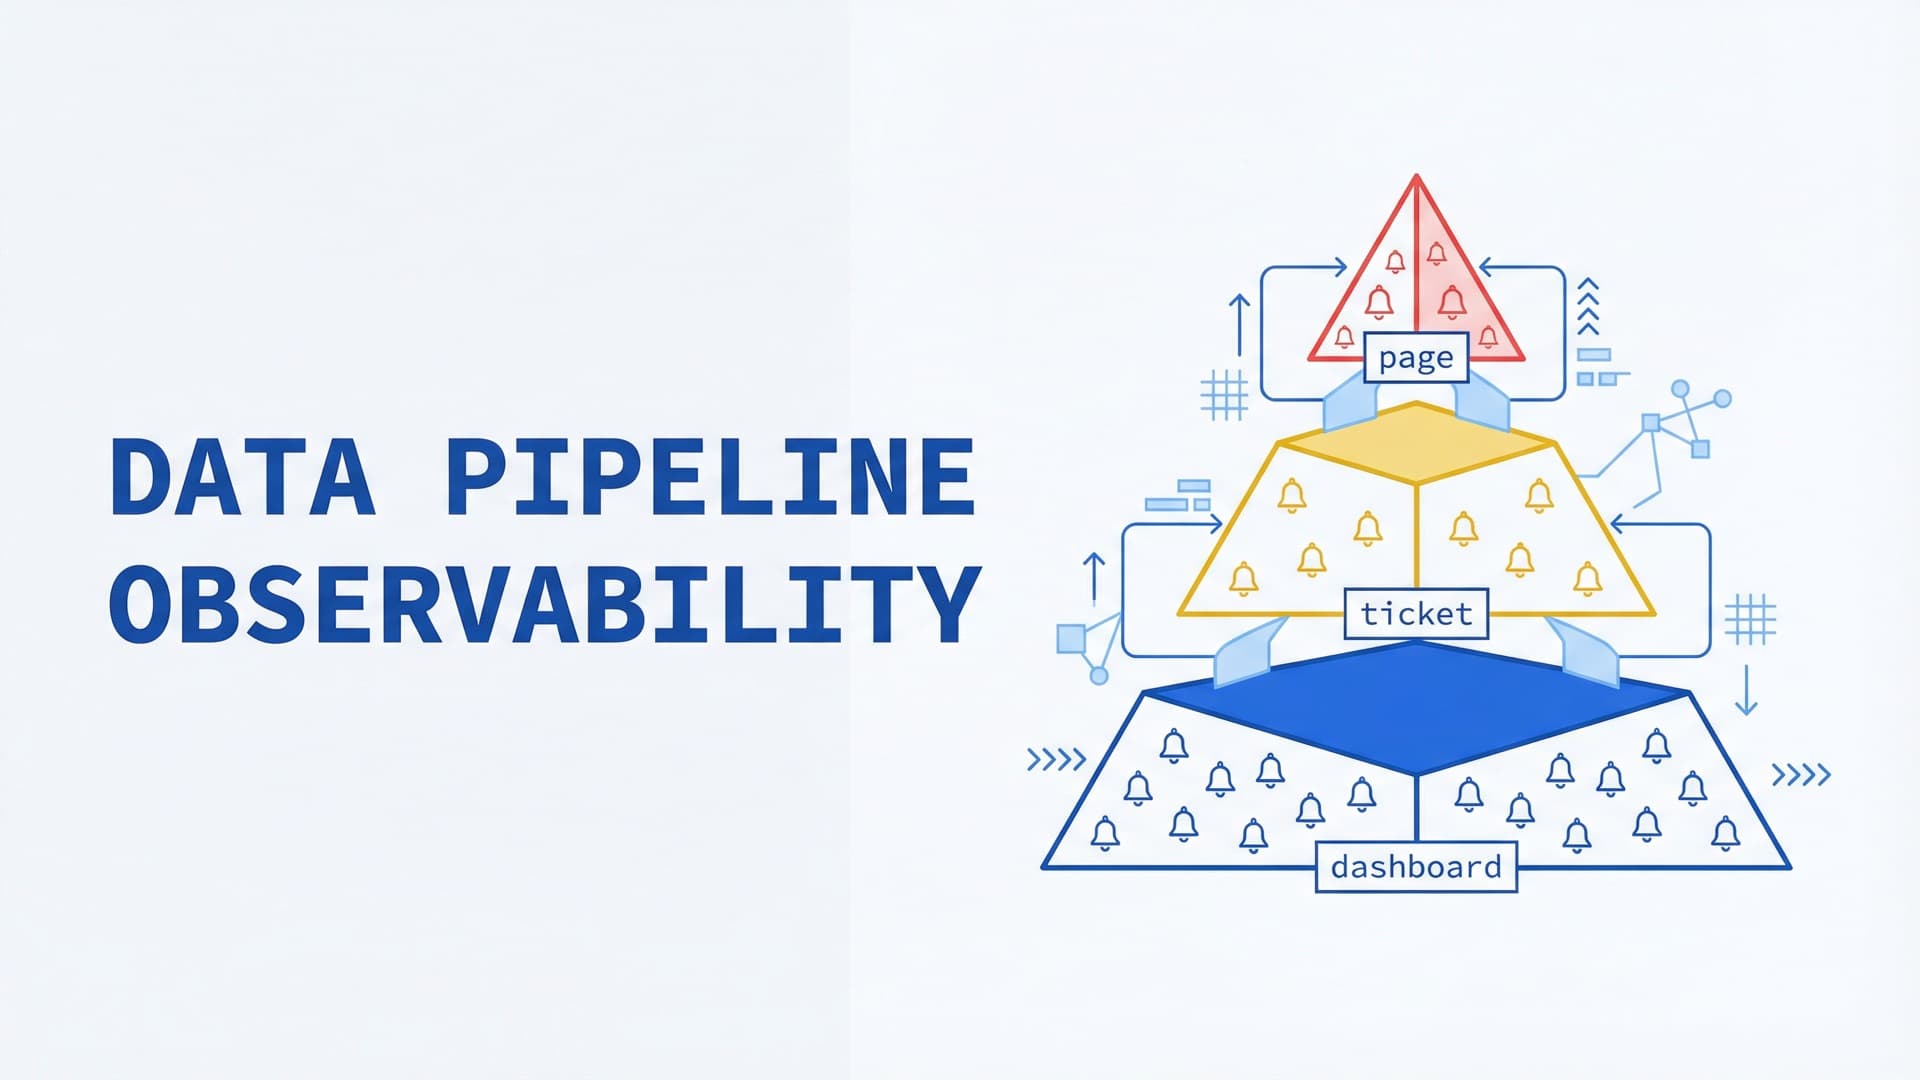
Data Pipeline Observability: Monitoring Airflow + dbt Without Drowning in Alerts
200 tests, 80 weekly alerts, and a Slack channel nobody reads. That's alert debt. The monitoring stack that catches real failures without burying your team.