Sprint Velocity with a New Dedicated Team: Realistic Expectations by Month
A vendor promises "productive in two weeks." The PM nods and signs. Month two, the team is shipping roughly half of the sprint plan. By month four, velocity has barely moved. Six months in, the team has settled at a ceiling well below projection — and stays there, because nothing done in the first quarter pushed it higher.
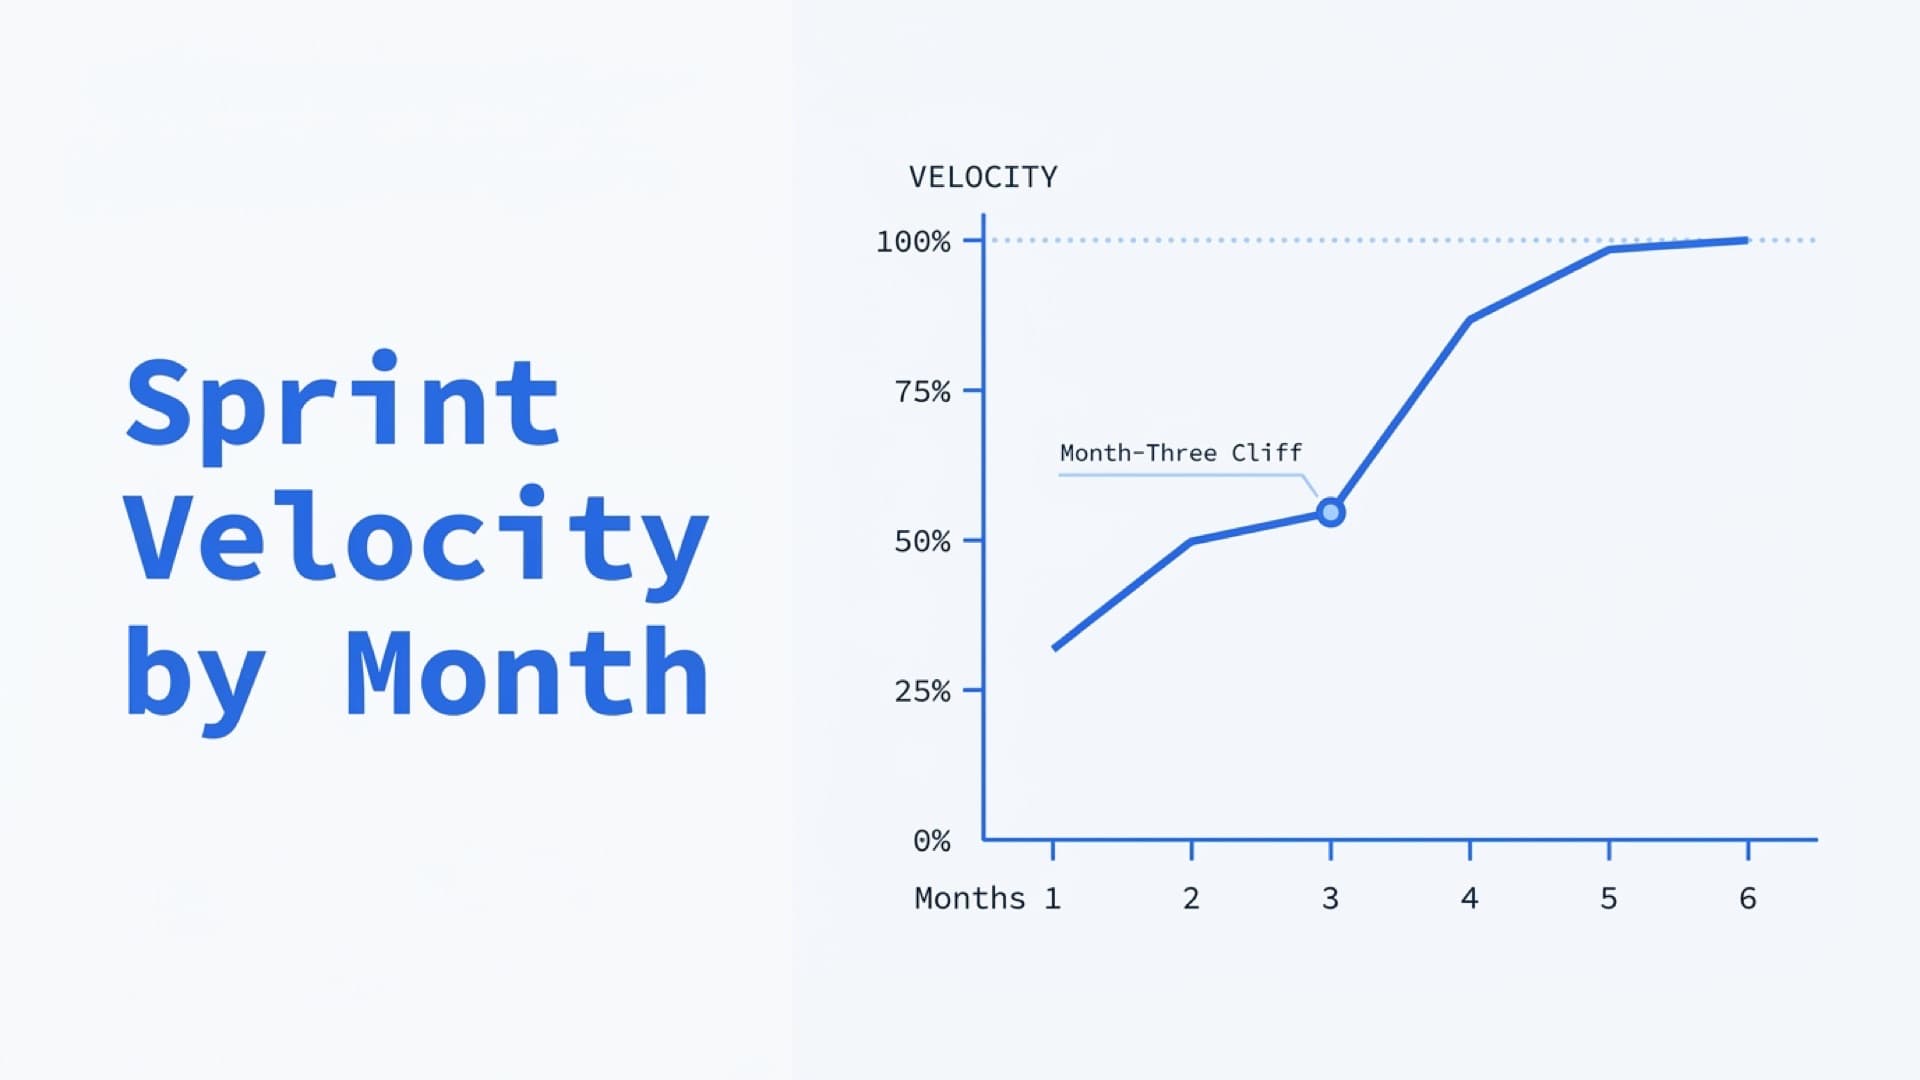
The industry shorthand for this is "ramp-up." The more accurate name is The Month-Three Cliff: the point in a new dedicated team engagement where velocity either starts accelerating toward full or stalls at a sub-par ceiling for the rest of the contract. Everything that happens in months one through three decides which way the team falls off the cliff.
Real velocity curves for new dedicated teams aren't a straight climb. They're a sequence of discrete transitions: first commit, first production ticket, first independent sprint, first architectural call the team makes without client input. Each of those opens a higher velocity tier. Miss one and the team plateaus.
What the Research Says
There isn't a single longitudinal study measuring dedicated-team sprint velocity across a statistically significant sample — one of the gaps that makes vendor claims hard to verify. What exists is several related datasets that triangulate to the same ranges.
The IEEE study across 80 engineering organizations measured onboarding ramp for new hires and found 3-9 months to full productivity as the industry norm. The same research found that cutting ramp time in half saves the equivalent of 17 developer-years per year across new hires at a typical organization — a number that is only possible if ramp cost is much larger than most engineering orgs admit.
Practitioner data from remote-first companies converges on similar numbers. GitLab's public onboarding handbook structures new-hire milestones at day 1, week 1, month 1, month 3, and month 6 — explicitly treating month three as a distinct checkpoint where expectations step up. The Wise CTO's onboarding playbook puts daily 2-hour pairing sessions on real sprint tasks as the first-week pattern and frames the first full sprint (usually weeks 2-3) as the gating event for velocity measurement.
The composite curve across those sources:
| Timeframe | Effective Velocity | What's Happening | |-----------|-------------------|------------------| | Week 1-2 | 10-25% | Environment setup, onboarding, codebase read | | Week 3-4 | 25-40% | First meaningful commits, heavy pairing | | Month 2 | 40-65% | First full sprint, quality catching up | | Month 3 | 65-85% | Independent work on known parts of codebase | | Month 4-6 | 85-100% | Full velocity, domain knowledge accumulated |
The ranges are wide because the variance drivers are large. The team that shows up at 25% in week two and 80% in month three is not the same team that shows up at 12% in week two and 45% in month three, even if the engineers are equally skilled.
The Month-Three Cliff
Month three is the pivot because it's the first full quarter of work. The team has run two or three complete sprints. First PRs are in production. First incident has been handled. First architectural disagreement has been resolved. Everything the onboarding plan promised has either happened or it hasn't.
Teams that cross the cliff well share three observable properties at month three:
Engineers are closing tickets without daily direction from the client tech lead. The client PM still writes the backlog, still attends standup, still reviews priority. But the day-to-day of translating a ticket into working code is happening inside the vendor team without external help. Silent correctness is the signal.
Code review turnaround is under 24 hours. Graphite's research on review turnaround flags this as a leading indicator of delivery velocity — slow review times cascade into blocked work, which cascades into velocity drops. A team that hits 24-hour review turnaround by month three is structurally capable of stable delivery.
The team is asking architectural questions, not permission questions. Month one questions sound like "what do you want us to do?" Month three questions sound like "we're thinking about approach A or approach B — A scales better but takes a sprint longer, B is faster but we'd want to refactor in Q2." That shift from execution to judgment is what you paid for, and it's either there by month three or it isn't.
The inverse pattern is also observable. Teams that don't cross the cliff by month three tend to stay where they are: PR review is slow, architectural decisions get deferred or kicked to the client, velocity stabilizes well below the sprint plan. The team is shipping — just never at the level the contract implied. Nobody fires anyone because things technically work. That's the expensive version of failure. It doesn't look like failure.
What Drives Faster Ramp
Four factors, drawn from the GitLab, Wise CTO, and TechClass onboarding playbooks, explain most of the variance between teams that hit month-three full velocity and teams that stall.
1. Documentation that exists before onboarding starts
The dominant bottleneck in the first month is the new engineer not knowing where things are. Every hour spent finding a README, figuring out how a service gets deployed, or asking what a variable name means is an hour not spent shipping. TechClass's onboarding research finds that engineers in well-documented environments submit their first PR on day 3 and complete their first feature by day 15. Engineers without that infrastructure are still in the "what does this even do" phase at week three.
The minimum documentation set that materially compresses ramp:
- Runbook for local environment setup. One command should provision a working dev environment. Two hours should take you from clone to passing local test suite.
- Architectural overview with system boundaries. Not exhaustive — just enough that a new engineer can explain which service does what in their first week.
- Deploy path end-to-end. How does a commit reach production? Who signs off? What are the gates?
- Historical decisions. ADRs (Architecture Decision Records) or equivalent notes on why the codebase looks the way it does. This is the highest-value documentation most teams don't have.
Vendors call this documentation "the client's responsibility" and they're right — but skipping it is how clients end up buying the slower curve while paying the faster-curve rate.
2. Real work in week one, not training
The pattern that stalls ramp is giving new engineers isolated "warm-up" tickets that don't touch production and don't get reviewed seriously. The engineers execute, the PM nods, and nobody learns anything. Two weeks in, the team still hasn't touched the real system.
The Wise CTO's playbook prescribes the opposite: day one pairs an experienced engineer with a new one on a real sprint task for two hours. The new engineer watches, asks questions, and contributes. By day three they're submitting the PR themselves, with the experienced engineer reviewing. By week two they're running their own tickets, with lightweight supervision.
3. A single-surface zone in the first month
New engineers ramp best on a clearly-scoped surface area. The pattern that stalls: dropping them into backlog triage where consecutive tickets touch different services. The cognitive load of context switching dominates the week — a pattern that Team Topologies research on cognitive load identifies as a first-order driver of engineering team underperformance — and real learning never accumulates.
The fix is trivially named and rarely executed: assign a "zone" for the first month. One service, one codebase area, one feature surface. The new engineer builds depth there first. Breadth comes in month two when they have the base to anchor it to.
4. A buddy in the existing team, not just a manager
New engineers need a peer they can DM with dumb questions. Asking the client tech lead "what's this variable for?" is expensive — three questions in a day and the lead stops pattern-matching them as low-cost. Asking a peer is free. GitLab's onboarding model explicitly assigns a "buddy" separate from the manager for exactly this reason. Companies that skip it push the cost of every question onto the manager, who then spends half their capacity as a help desk.
How to Measure Ramp
Most engineering orgs measure dedicated team ramp with story points, which is mostly useless because story point velocity isn't calibrated across teams. The following leading indicators are observable and don't require calibration:
- First commit day. From onboarding day to first code in the repo. Target: day 3-5. Flag: day 10+.
- First reviewed PR merged. From start to first PR through review into main. Target: week 1-2. Flag: week 3+.
- First feature ticket completed independently. Start to first feature-scoped ticket (not a "warm-up") delivered without pair programming. Target: week 4-6. Flag: week 8+.
- First solo sprint. The first full sprint where the engineer is an independent unit of velocity, not a shadow. Target: month 2-3. Flag: month 4+.
- First on-call rotation. Entry into the production on-call schedule — the signal that the team trusts the engineer to own production behavior. Target: month 3-4. Flag: month 6+.
If any two of these are in flag territory by month three, the team is heading for the wrong side of The Month-Three Cliff. Month three is the last point where a structural intervention — reassigning surfaces, adding documentation, changing the pairing pattern — tends to produce visible velocity change. Past month five, most teams have absorbed the low-velocity pattern into their default workflow and it stops responding to tactical fixes.
Honest Boundary
The curves and timelines in this post are composites from multiple sources — IEEE ramp-up research, GitLab and Wise CTO onboarding playbooks, TechClass's onboarding dataset, Graphite's PR review benchmarks — not a single longitudinal study of dedicated-team velocity. That study doesn't exist yet publicly. The composite is directionally useful; precise numbers for any given team will move with:
- Codebase complexity and size. A 50K-line Python service ramps differently than a 2M-line distributed system. The month-three cliff is earlier and less severe for smaller codebases; later and steeper for mature, sprawling ones.
- Stack familiarity. An engineer with five years of Go on a Go codebase ramps materially faster than the same engineer on a new stack they have to learn alongside the codebase. New-stack ramp compounds the IEEE ramp curve with the baseline cost of learning a language and its idioms.
- Team composition. A 4-person team onboarding into a new engagement ramps faster per-engineer than a 10-person team onboarding simultaneously — the larger team creates coordination overhead the smaller one doesn't face.
- Engagement structure. Greenfield engagements where the team builds the codebase ramp differently than brownfield engagements where they inherit someone else's architecture.
This framework assumes a vendor with a defined onboarding process — documented runbooks, named buddy assignment, a first-week pairing plan. Without those artifacts, the curve runs slower from day one regardless of engineer quality.
Need help designing a dedicated team onboarding that actually compresses ramp? Talk to an engineer.
Month three is the cliff. You fall off it in the first four weeks, or you don't.
Frequently Asked Questions
How long does it take for a new dedicated team to reach full velocity?
Three to nine months based on IEEE research across 80 engineering organizations. A realistic composite curve: 10-25% velocity in weeks 1-2, 25-40% in weeks 3-4, 40-65% in month 2, 65-85% in month 3, and 85-100% in months 4-6. Teams that don't hit 65%+ by month three typically stall at 55-70% permanently rather than continuing the climb.
What is the most important milestone in dedicated team ramp-up?
Month three. By the end of the first full quarter, a new team has run 2-3 complete sprints and the velocity trajectory is locked in. Teams that cross this "Month-Three Cliff" with engineers closing tickets independently, PR review under 24 hours, and architectural questions instead of permission questions continue toward full velocity. Teams that don't typically stall at 55-70% for the remainder of the engagement.
How do I measure if a new dedicated team is ramping properly?
Track observable leading indicators rather than story points. First commit should land by day 3-5, first reviewed PR by week 1-2, first independently-completed feature ticket by week 4-6, first solo sprint by month 2-3, and entry into on-call rotation by month 3-4. If two or more of these slip past the flag threshold by month three, intervene immediately — the window to correct closes quickly.
What's the biggest factor that slows new dedicated team ramp-up?
Missing documentation that should exist before the team starts. Engineers in well-documented environments submit their first PR on day 3 per TechClass's onboarding research; engineers without that infrastructure are still orienting at week three. The minimum set: one-command local environment setup, architectural overview with system boundaries, deploy path documentation, and Architecture Decision Records explaining why the codebase looks the way it does.
Can a vendor really get a dedicated team to full velocity in two weeks?
No. The "productive in two weeks" pitch is marketing, not measurement. IEEE's 80-organization ramp-up research finds full productivity takes 3-9 months industry-wide, even for in-house hires who don't carry the additional friction of cross-vendor onboarding. A vendor who promises two-week full velocity is either redefining "productive" to mean "first commit landed" or setting the engagement up to miss its own implied timeline.
Related posts
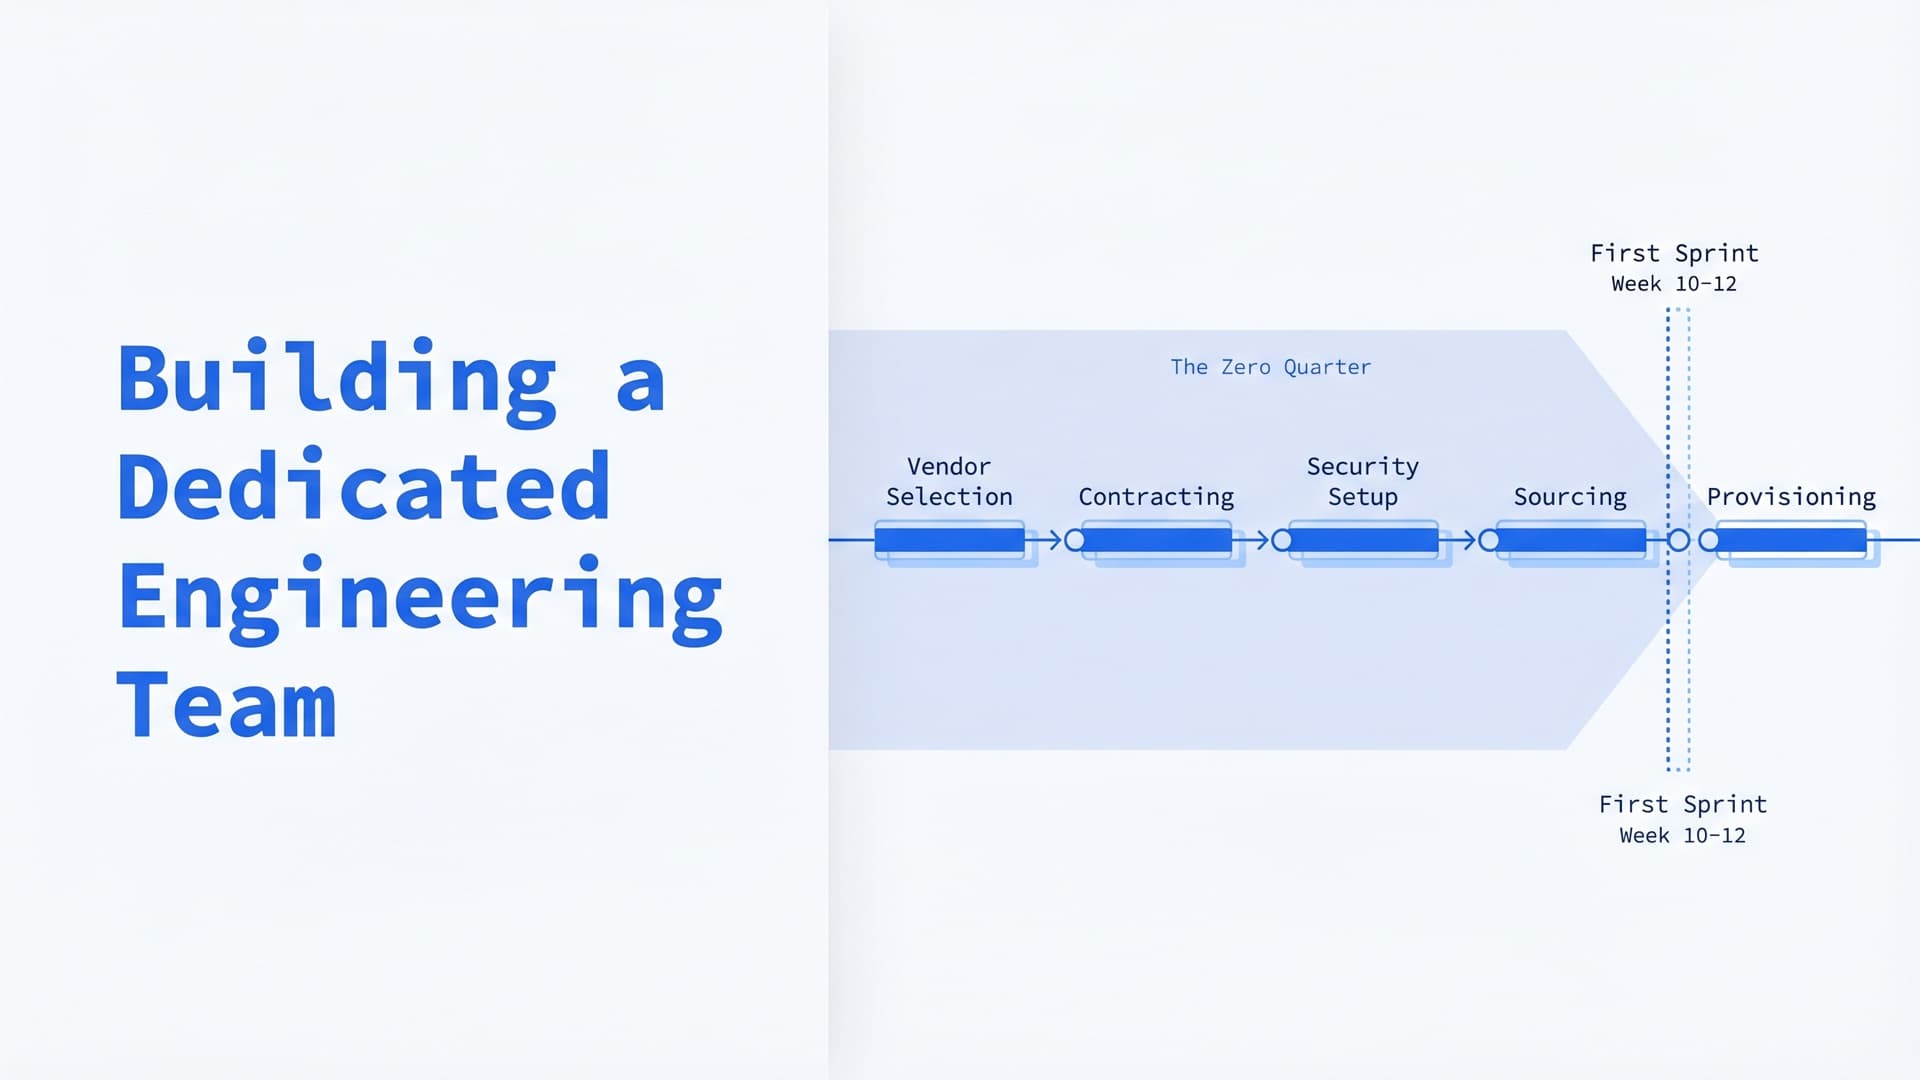
Building a Dedicated Engineering Team from Scratch: Timeline, Cost, and Mistakes
Vendor decks show 2 weeks. The real timeline is 10-16 weeks. Call it The Zero Quarter — everything between decision and first sprint. Cost model, worked example, and the five setup mistakes that compound.
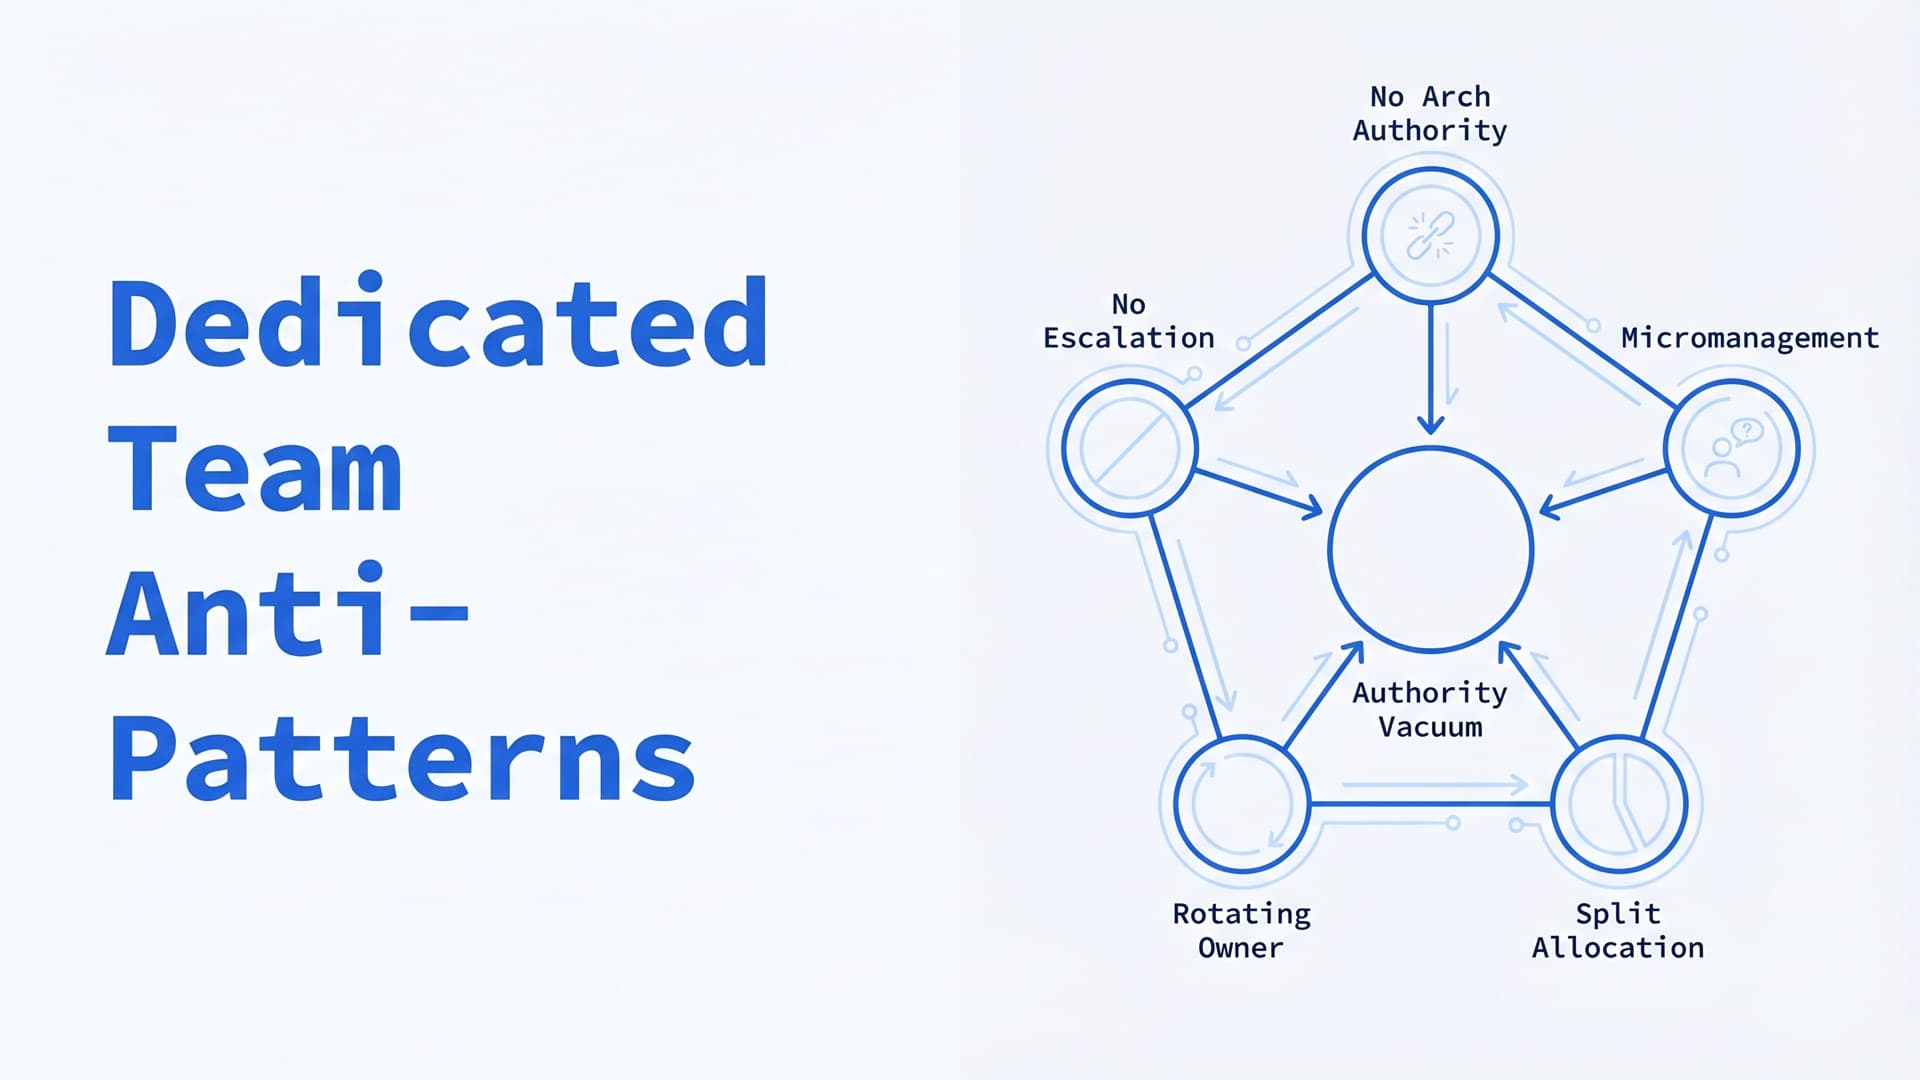
Dedicated Team Anti-Patterns: 5 Governance Failures That Kill Productivity
Five governance failures account for most dedicated team engagement failures — and none of them are about engineer quality. The Authority Vacuum, the five patterns it creates, and how to diagnose which one you have.
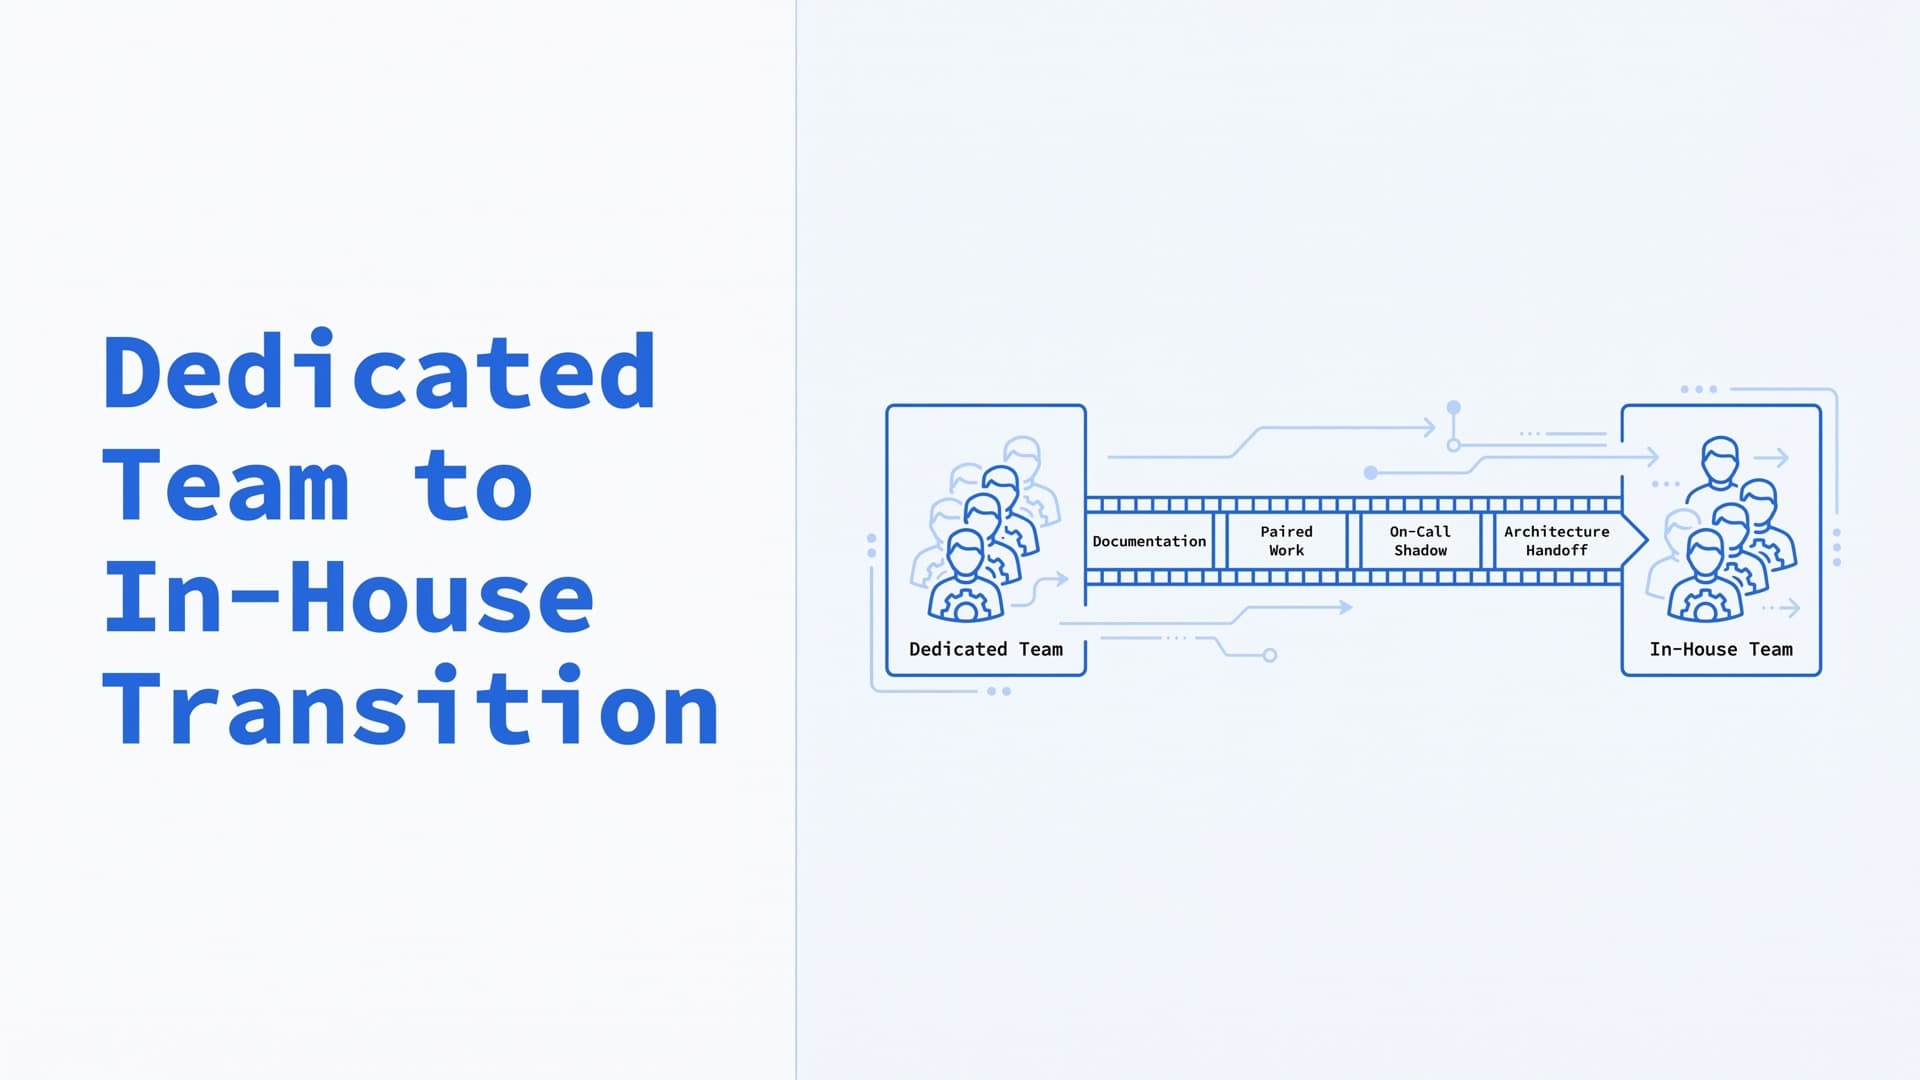
When to Bring a Dedicated Team In-House (And How to Do the Transition)
70% of executives have selectively insourced. The Knowledge Bridge is what separates successful transitions from expensive restarts. Signals, playbook, and the four failure modes that sabotage in-housing.