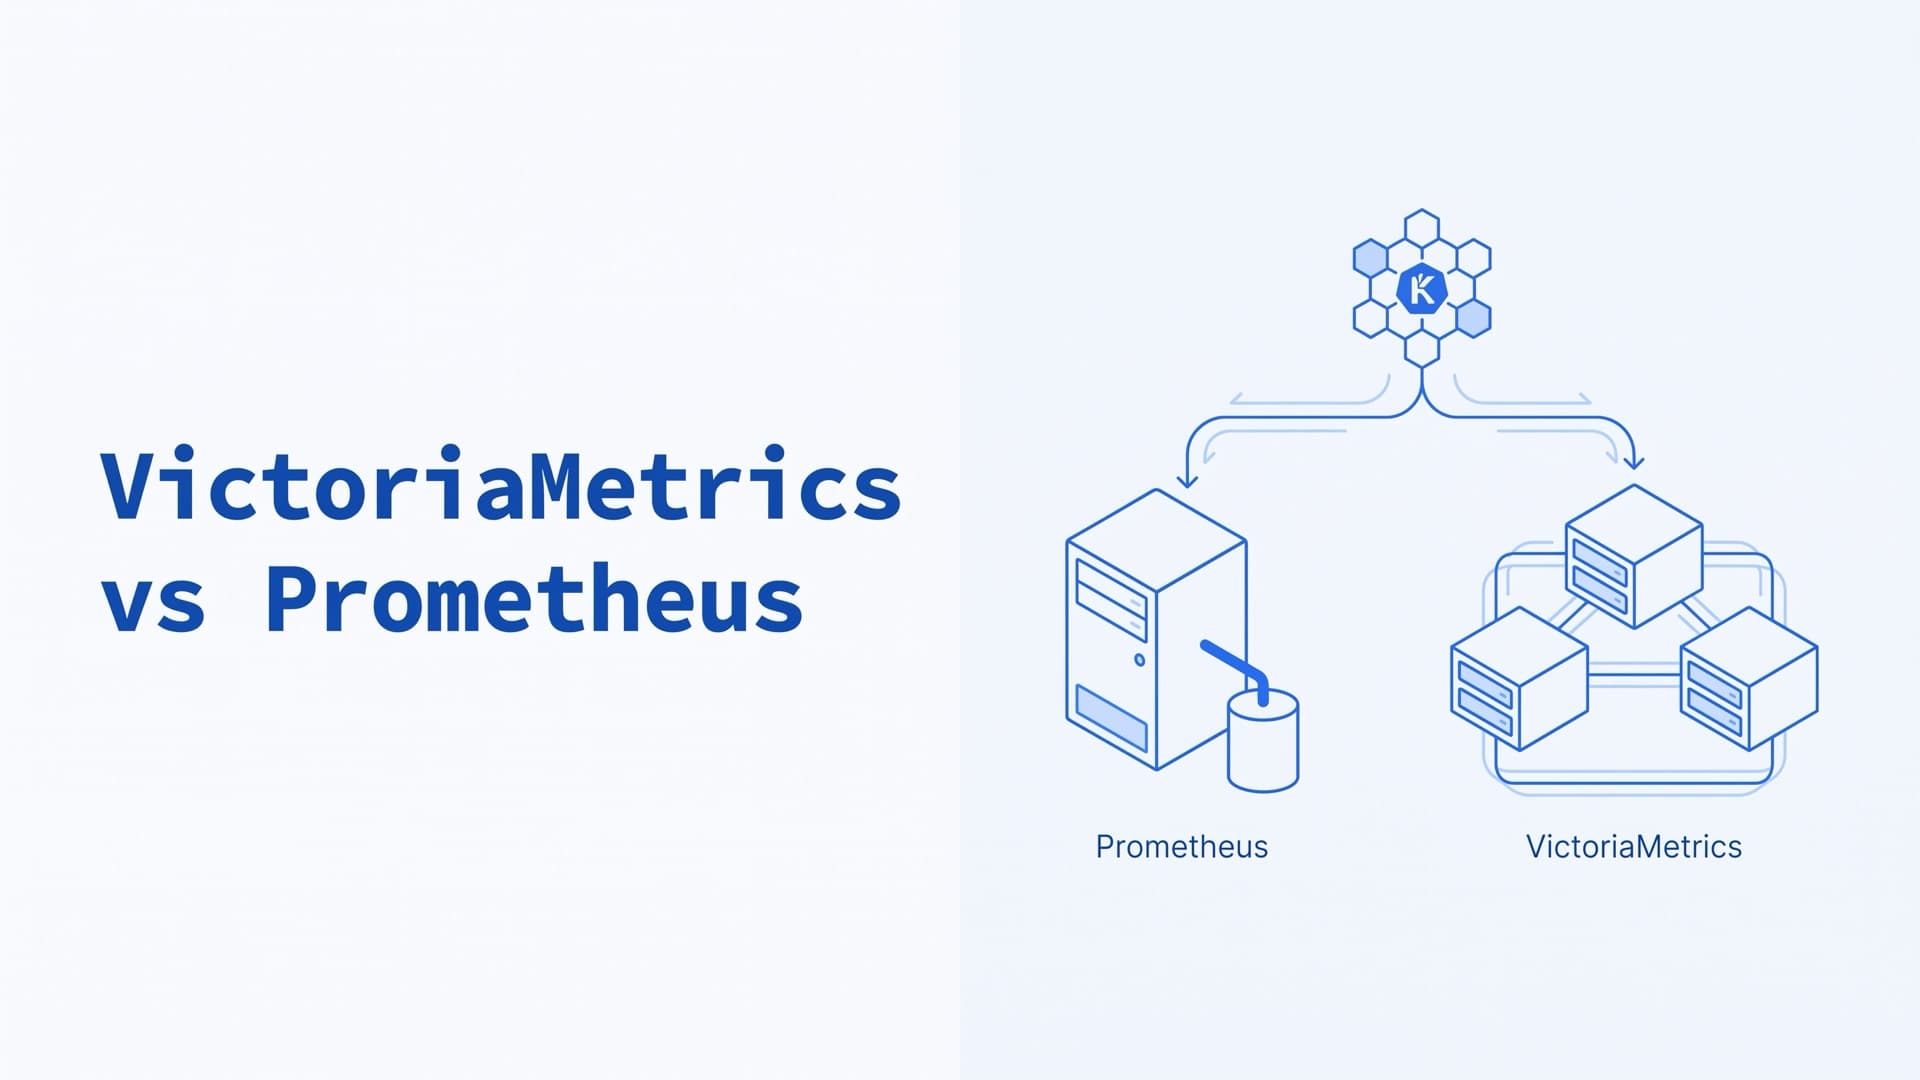
VictoriaMetrics vs Prometheus: Differences & When to Switch
What is the difference between VictoriaMetrics and Prometheus?
Prometheus scrapes metrics and stores them on one server, without clustering or replication. VictoriaMetrics is a Prometheus-compatible time-series database with an open-source cluster version. It doesn't have to replace Prometheus. You can send Prometheus data to it for long-term, highly available storage, or replace the Prometheus server with vmagent. Prometheus alone suits one cluster whose history fits on one server.
We run Prometheus with VictoriaMetrics as its storage and keep metrics for two years. Our setup section explains why we moved. This guide also covers Thanos, Grafana Mimir and migration. All sources were checked in October 2026.
VictoriaMetrics vs Prometheus at a glance
The table compares self-managed installs as of October 2026.
| Aspect | Prometheus | VictoriaMetrics |
|---|---|---|
| Latest release | 3.15.0, Sep 24 | 1.154.0, Oct 9 |
| License | Apache 2.0 | Apache 2.0, plus paid Enterprise |
| LTS release | 3.13, supported to July 2027 | Enterprise only |
| Project home | CNCF, graduated | VictoriaMetrics, the company |
| Storage | Local disk, one node | Local disk, node or cluster |
| Clustering | None built in | Open-source cluster version |
| High availability | Identical server pairs | Replicas or cluster replication |
| Default retention | 15 days | 1 month |
| Query language | PromQL | MetricsQL, mostly PromQL-compatible |
| Collection | Pull, opt-in push via OTLP or remote write | Pull and push |
| Kubernetes | Prometheus Operator | VictoriaMetrics operator |
What are Prometheus and VictoriaMetrics?
Prometheus
Prometheus is an open-source monitoring and alerting toolkit, started at SoundCloud in 2012 (overview). It joined the CNCF in 2016 and graduated in August 2018 (CNCF). The server scrapes metrics over HTTP, stores them locally and runs rules that record new series or fire alerts. Alertmanager routes the alerts, and PromQL is the query language.
Each server stands alone, so you can rely on it when other parts of your infrastructure break (overview). Every component is under Apache 2.0. Version 3.13 is the long-term support release and gets selected fixes until July 31, 2027 (release cycle).
VictoriaMetrics
VictoriaMetrics is a time-series database plus monitoring tools, written in Go from scratch (FAQ). Single-node VictoriaMetrics is one executable with no external dependencies. The open-source cluster version splits the work across vminsert, vmselect and vmstorage (cluster). Around them sit vmagent for collection, vmalert for rules, vmauth for routing and vmctl for migration (components).
It accepts Prometheus remote write, scrapes Prometheus targets and takes push formats such as InfluxDB line protocol and OpenTelemetry (features). It answers queries in MetricsQL, a language inspired by PromQL, through the Prometheus query API. The code is under Apache 2.0. The company behind it sells an Enterprise edition, support and a hosted service, VictoriaMetrics Cloud (FAQ).
How to use VictoriaMetrics with Prometheus
You can combine the two in three ways. They differ in which program scrapes targets, which one keeps history and which one runs rules.
| Setup | Scrapes | Keeps history | Runs rules |
|---|---|---|---|
| Prometheus alone | Prometheus | Prometheus | Prometheus |
| Prometheus + remote write | Prometheus | VictoriaMetrics | Prometheus or vmalert |
| vmagent + VictoriaMetrics | vmagent | VictoriaMetrics | vmalert |
1. Prometheus alone
Prometheus scrapes, stores and evaluates rules, and it sends alerts to Alertmanager. It keeps 15 days of data by default (storage).
2. Prometheus plus VictoriaMetrics as remote storage
Prometheus keeps scraping and alerting, and remote_write sends a copy of every sample to VictoriaMetrics. Prometheus keeps its local copy too, so recent data stays queryable there while VictoriaMetrics is down (VictoriaMetrics docs). The docs give this prometheus.yml block.
remote_write:
  - url: http://<victoriametrics-addr>:8428/api/v1/write
Failed sends are retried, and unsent data is lost only if the store stays down for more than two hours. Remote write also adds memory, and the Prometheus docs say most users report about 25% more (remote write tuning). Grafana reads long history from VictoriaMetrics directly. Prometheus can't query it back, because VictoriaMetrics doesn't support the remote read API (FAQ).
With the Prometheus Operator, the URL goes into the remoteWrite list of the Prometheus resource (API reference). Our kube-prometheus-stack guide shows the Helm values and how to deduplicate HA replicas.
3. vmagent plus VictoriaMetrics, without a Prometheus server
vmagent reads the scrape configs in your prometheus.yml and writes the samples to VictoriaMetrics (vmagent).
/path/to/vmagent \
  -promscrape.config=/etc/prometheus/prometheus.yml \
  -remoteWrite.url=http://<victoriametrics-addr>:8428/api/v1/write
vmagent doesn't support the remote_write, remote_read, rule_files and alerting sections of that file (unsupported sections). Delete them, or pass -promscrape.config.strictParse=false so vmagent skips them (quick start). Rules move to vmalert, which queries VictoriaMetrics and sends alerts to your Alertmanager (vmalert). Single-node VictoriaMetrics can also scrape targets itself with the same -promscrape.config flag (scraping).
Prometheus in agent mode, started with --agent, can take vmagent's place here. It keeps scraping and remote write but drops local queries, rules and alerting (agent mode).
Prometheus long-term storage and retention vs VictoriaMetrics
Prometheus writes samples into two-hour blocks on local disk, guarded by a write-ahead log, and later compacts them into larger blocks (storage). Retention defaults to 15 days. Raise it with --storage.tsdb.retention.time, or cap disk use with --storage.tsdb.retention.size. The docs put the average at 1 to 2 bytes per sample and say that, with proper architecture, local storage can keep years of data. That storage still isn't clustered or replicated, so the docs advise managing it like any single-node database, with snapshots for backups.
VictoriaMetrics sets retention with one flag, -retentionPeriod. It defaults to one month, the minimum is one day, and units run from hours to years (retention). Data sits in monthly partitions, and a partition is deleted on the first day of the month after it leaves retention. So plan disk for the retention period plus one month.
# Prometheus: keep 90 days
--storage.tsdb.retention.time=90d

# VictoriaMetrics: keep 90 days
-retentionPeriod=90d
The open-source version keeps one retention per instance. Different retentions for different series need retention filters, an Enterprise feature. The free alternative in the docs is one instance per retention, with vmauth routing each user to the right one (multiple retentions).
The disks differ too. Prometheus doesn't support NFS, Amazon EFS included (storage). VictoriaMetrics supports NFS-based storage such as Amazon EFS and Google Filestore (features).
Prometheus high availability vs VictoriaMetrics clustering
Prometheus doesn't cluster. For clustered storage, its docs point to integrations with remote storage systems (storage). For high availability, the FAQ says to run identical servers on two or more machines. Alertmanager deduplicates their alerts, and Thanos or a remote write store can deduplicate their data (FAQ). Each server keeps a full copy, as our kube-prometheus-stack guide explains. This lack of clustering and built-in high availability is why we moved our storage to VictoriaMetrics.
VictoriaMetrics offers two routes.
- Single-node replicas. Run two or more identical instances. vmagent writes to each one through its own
-remoteWrite.url, with a disk queue for any replica that is down. For reads, vmauth balances queries across replicas, or a top-level vmselect queries all of them and merges the results (high availability). - The cluster version. vminsert spreads data across vmstorage nodes, which share nothing with each other, and vmselect queries all of them (architecture). With
-replicationFactor=N, vminsert stores N copies of each sample on different nodes. Keeping that factor while N-1 nodes are down takes at least 2N-1 vmstorage nodes (replication).
Both routes need deduplication when two scrapers send the same series. Set -dedup.minScrapeInterval to your scrape interval, and give both scrapers identical labels (deduplication).
VictoriaMetrics recommends the single-node version for ingestion below a million samples per second, and calls it easier to run (cluster). Its FAQ says single-node VictoriaMetrics handles up to 100 million active series and 2 million samples per second, based on real usage (FAQ). It also says, "Don't choose VictoriaMetrics cluster unless you have to" (FAQ). Built-in multitenancy comes only with the cluster version. The two versions use different on-disk formats, so a later move means running both side by side or re-importing with vmctl (migration).
PromQL vs MetricsQL compatibility
VictoriaMetrics answers PromQL through the Prometheus query API. Its docs say MetricsQL is backwards-compatible with PromQL, so Grafana dashboards built on a Prometheus data source "should work the same" after a switch (MetricsQL). The same page lists intentional differences.
rate()andincrease()count the last sample before the window, and they don't extrapolate. Over a slow integer counter,increase()returns whole numbers where Prometheus can return fractions.- Functions that don't change a series' meaning, such as
round()andmin_over_time(), keep the metric name. - NaN values are dropped, so some queries return nothing where Prometheus returns NaN series.
To skip that earlier sample as Prometheus does, use increase_prometheus() and rate_prometheus() (increase_prometheus).
# MetricsQL: also counts the last sample before the window
increase(http_requests_total[1h])

# Skips that sample, as Prometheus does
increase_prometheus(http_requests_total[1h])
The docs note a few more differences.
- Staleness. Prometheus looks back 5 minutes by default for each series' latest sample, set by
--query.lookback-delta(staleness). VictoriaMetrics picks that window from the interval between samples unless you set-search.maxLookback(flags). Its default query function uses the staleness markers that Prometheus and vmagent write when a series disappears (default_rollup). - Precision. VictoriaMetrics may reduce the precision of floats with more than 12 significant decimal digits (FAQ).
- Native histograms. Prometheus made them stable in 3.8. VictoriaMetrics converts them on ingestion into classic buckets with a
vmrangelabel, whichhistogram_quantile()still reads (native histograms). - Extensions. MetricsQL adds syntax such as
WITHtemplates, optional lookbehind windows andlimit Non aggregations (features). Dashboards that use them won't work against plain Prometheus.
vmagent vs Prometheus for scraping and remote write
Prometheus and vmagent scrape the same exporters from the same scrape config format. They differ in buffering, push support, scale and protocol.
- Buffering. Prometheus remote write reads from the write-ahead log, which holds about two hours (remote write tuning). Agent mode has the same two-hour buffer (agent mode). vmagent keeps a separate disk queue for each destination in
-remoteWrite.tmpDataPath. When the queue reaches-remoteWrite.maxDiskUsagePerURL, vmagent drops the oldest data (on-disk persistence). - Push. Prometheus pulls, with the Pushgateway for short-lived jobs (FAQ). It can also receive OTLP and remote write pushes once you turn on
--web.enable-otlp-receiveror--web.enable-remote-write-receiver(OpenTelemetry guide, storage). vmagent and VictoriaMetrics accept those and the other push formats listed above (vmagent). - Scale. vmagent can split targets across several instances (sharding). VictoriaMetrics says vmagent usually needs less CPU and RAM than Prometheus beyond 1,000 targets (FAQ).
- Protocol. Prometheus supports Remote Write 1.0 and an experimental 2.0 (storage). VictoriaMetrics doesn't currently support 2.0, so keep the default 1.0 message (remote write 2.0).
Prometheus Operator vs VictoriaMetrics operator
The Prometheus Operator, now at v0.94.1, runs Prometheus, Prometheus in agent mode and Alertmanager from Kubernetes custom resources. ServiceMonitor, PodMonitor, Probe and ScrapeConfig describe what to scrape, and PrometheusRule holds the rules (README).
The VictoriaMetrics operator, now at v0.75.0, runs VMSingle, VMCluster, VMAgent, VMAlert, VMAlertmanager and VMAuth. Its own scrape and rule objects include VMServiceScrape, VMPodScrape and VMRule (resources). By default it converts ServiceMonitor, PodMonitor, PrometheusRule, Probe and ScrapeConfig objects into its own and keeps them in sync. It doesn't delete the converted objects when the originals go, and its docs say this lets you "safely migrate or run two operators at the same time" (converter). It doesn't install the Prometheus CRDs, so they must already be in the cluster. To stop converting a kind, pass it to -controller.disableReconcileFor.
For a new cluster, we would start from the VictoriaMetrics operator.
One default is worth changing. The operator puts vmagent's disk queue in /tmp, so a pod restart loses unsent data. Set statefulMode: true with a statefulStorage volume claim template to keep the queue on a persistent volume (VMAgent).
Each stack has an all-in-one Helm chart. Prometheus has kube-prometheus-stack, and VictoriaMetrics has victoria-metrics-k8s-stack. That chart installs the VictoriaMetrics operator with Grafana, node-exporter, kube-state-metrics and the dashboards and recording rules from kube-prometheus (k8s-stack).
If you plan to move Prometheus Operator objects to VictoriaMetrics, our Kubernetes consulting team starts with read-only access and a written list of what to fix first.
VictoriaMetrics vs Prometheus performance and resource use
VictoriaMetrics says it needs up to 7x less RAM than Prometheus with millions of series, and up to 7x less storage (features). Both claims link to a benchmark that its co-founder and CTO, Aliaksandr Valialkin, published in November 2020. It ran Prometheus 2.22.2 and VictoriaMetrics 1.47.0 on identical machines for 24 hours, scraping 3,400 emulated node_exporter targets. Its own conclusion is up to 5x less RAM and up to 7x less disk space.
The test predates Prometheus 3.0, released in November 2024 (release). VictoriaMetrics' docs also warn that vendors, itself included, are often biased in such tests, and they ask users to run their own (benchmarks). The Prometheus FAQ says "doesn't scale" is often more of a marketing claim. It says one Prometheus server runs reliably with tens of millions of active series (FAQ).
To test your own workload, VictoriaMetrics publishes prometheus-benchmark, which loads Prometheus-compatible stores, Mimir and Thanos included, with node_exporter metrics.
VictoriaMetrics open source vs Enterprise features
Single-node and cluster VictoriaMetrics are open source and free (FAQ). Enterprise builds ship on the same release pages with an enterprise suffix. You may evaluate them outside production with a trial license, and production use needs a contract (Enterprise). As of October 2026, these features need Enterprise.
| Need | Open source | Enterprise |
|---|---|---|
| Downsampling | No | -downsampling.period |
| Several retentions | One per instance | -retentionFilter |
| Backups | vmbackup, vmrestore | Plus vmbackupmanager |
| Kafka, Pub/Sub | No | Yes |
| mTLS between components | No | Yes |
| LTS releases | No | 12 months of fixes |
The Enterprise list also includes automatic discovery of vmstorage nodes, anomaly detection, per-tenant statistics, multitenant vmalert and FIPS 140-3 builds. The current LTS lines are v1.148.x and v1.136.x. Open-source users get the same fixes in the latest release, and the docs advise them to upgrade regularly (LTS).
Downsampling keeps the last sample per interval. For example, -downsampling.period=30d:5m,180d:1h keeps one sample per 5 minutes after 30 days and one per hour after 180 days. It suits counters and histograms, while gauges lose changes within each interval (downsampling).
Thanos vs Mimir vs VictoriaMetrics
Thanos and Grafana Mimir also give Prometheus long-term, highly available storage. This section describes them from their docs.
| Aspect | Thanos | Mimir | VictoriaMetrics |
|---|---|---|---|
| License | Apache 2.0 | AGPLv3 | Apache 2.0, plus Enterprise |
| Home | CNCF incubating | Grafana Labs | VictoriaMetrics |
| Latest | 0.42.4 | 3.2.2 | 1.154.0 |
| Data store | Object storage | Object storage | Block storage |
| Multi-tenancy | By external labels | Built in | Cluster version |
| Ingest | Sidecar or remote write | Remote write, OpenTelemetry | Remote write, scrape, push |
| Downsampling | 5m and 1h | None | Enterprise |
| Query language | PromQL | PromQL | MetricsQL |
What is Thanos?
Thanos adds components around the Prometheus servers you already run. A sidecar uploads each server's two-hour blocks to object storage, or Thanos Receive accepts remote write. Thanos Query merges all sources and removes duplicates from HA pairs (quick tutorial). The compactor downsamples old data to 5-minute and 1-hour resolution, which speeds up queries over months or years. Its docs say this doesn't save space. Keeping every resolution, the default, can make storage about three times larger (compactor).
What is Grafana Mimir?
Grafana Labs describes Mimir as horizontally scalable, highly available, multi-tenant long-term storage for Prometheus. Grafana Labs announced it in 2022, building on its work on Cortex, a CNCF incubating project.
Mimir takes Prometheus remote write and OpenTelemetry metrics (docs). Each request names a tenant unless multi-tenancy is turned off (auth). Blocks go to object storage such as S3 or Google Cloud Storage. Since 3.0, the preferred architecture puts Kafka in the write path (architecture). Mimir runs all components in one process or as separate microservices, and its docs recommend microservices for production (deployment modes). It doesn't downsample. Its docs say it doesn't support Thanos' downsampling (migration guide), and a community proposal to add downsampling has been open since May 2023 (PR #5028).
Mimir's AGPLv3 license requires you to offer your modified source to users who reach your version over a network (AGPLv3).
Thanos vs Mimir
Thanos fits when you want to keep your Prometheus servers and add object storage, a global view and downsampling around them. Mimir fits when Prometheus should write into one shared, multi-tenant store. VictoriaMetrics differs from both because it keeps data on block storage. Its FAQ argues that object storage usually costs less, while block storage gives lower latency and higher throughput (FAQ).
When to switch from Prometheus to VictoriaMetrics
The Thanos docs advise against scaling out Prometheus unless necessary, because one instance is already efficient (Thanos). Add a long-term store when history must outlive one server, or when several clusters need one view.
| Situation | Fits | Why |
|---|---|---|
| One cluster, history fits one server | Prometheus alone | Fewest parts to run |
| Two servers give enough uptime | A Prometheus HA pair | Alertmanager removes duplicate alerts |
| History must survive a lost disk or node | VictoriaMetrics, Thanos or Mimir | Replicas or object storage |
| Several clusters need one query view | VictoriaMetrics, Thanos or Mimir | One place to query |
| You want block storage and one binary to start | VictoriaMetrics single-node | Its docs advise it below 1M samples/s |
| You keep Prometheus and add object storage | Thanos | Sidecar uploads, compactor downsamples |
| Many tenants write to one object store | Mimir | Multi-tenant by default |
In every setup, series count and retention drive the cost, as our Kubernetes monitoring guide shows.
How to migrate from Prometheus to VictoriaMetrics
You can move in stages, with Prometheus untouched until VictoriaMetrics holds the data you need.
What stays the same and what changes
| Part | Stays the same | Changes |
|---|---|---|
| Exporters | Same targets | No change |
| Scrape configs | vmagent reads prometheus.yml | No remote_write or rule_files |
| Dashboards | Prometheus data source | Some results differ |
| Alert rules | Same rule format | Can run in vmalert |
| Alertmanager | Same | No change |
| Operator objects | Converted automatically | VM objects added |
vmalert reads the Prometheus rule format and sends alerts to Alertmanager (vmalert).
Migration steps
- Add VictoriaMetrics as remote storage. Keep Prometheus as it is and add
remote_write. Add VictoriaMetrics to Grafana as a second data source, and compare the same panels on both. If two Prometheus replicas send the same data, drop the replica label (prometheus_replicaunder the operator) and set-dedup.minScrapeIntervalto the scrape interval (deduplication). - Backfill history with vmctl. Take a snapshot through the Prometheus admin API, which needs
--web.enable-admin-api(API). Import it with vmctl, which must see the snapshot on its own filesystem (vmctl). VictoriaMetrics accepts old samples within its retention, and its docs suggest-search.disableCachewhile you backfill (backfilling). - Convert Kubernetes objects. Install the VictoriaMetrics operator and let it convert your ServiceMonitors, PodMonitors and PrometheusRules. The originals stay in place.
- Check dashboards and alerts. Compare
rate()andincrease()panels, series that stop reporting, and anything that showed NaN. If you move rules to vmalert, point it at your Alertmanager. Give it-remoteWrite.urland-remoteRead.url, or each restart resets active alerts (alert state). - Move scraping last, if at all. Once VictoriaMetrics holds the history you need, you can switch Prometheus to agent mode or replace it with vmagent. You can also stay on the second setup.
The snapshot and import from step 2 look like this.
curl -XPOST http://localhost:9090/api/v1/admin/tsdb/snapshot

./vmctl prometheus \
  --prom-snapshot=<data-dir>/snapshots/<name> \
  --vm-addr=http://<victoriametrics-addr>:8428
How we use VictoriaMetrics with Prometheus
In the clusters we run, Prometheus, run by the Prometheus Operator, collects metrics, and VictoriaMetrics stores them. We moved storage from Prometheus to VictoriaMetrics because Prometheus on its own has no clustering or built-in high availability. We keep metrics for two years. In all, we have about 6 million time series and about 7 trillion stored data points.
We track metric volume as inserts per minute and review it every week. Our monitoring guide tells the story of one jump that this review caught.
We dropped Zabbix long ago in favor of VictoriaMetrics. We still use Nagios for incident alerting and custom checks, because not every check is easy to write in PromQL. Logs go to VictoriaLogs, and we don't collect traces. We use no paid monitoring service.
We have run production systems since 2009 and have managed more than 1,350 production servers. If you're deciding how to store your clusters' metrics, our Kubernetes consulting team starts with read-only access and a written list of what to fix first. We can also run your clusters afterwards. On-call is by agreement, with up to 24-hour coverage under an SLA.
Frequently Asked Questions
Does VictoriaMetrics replace Prometheus?
It can, but it doesn't have to. VictoriaMetrics can store the data Prometheus sends by remote write, while Prometheus keeps scraping and alerting. VictoriaMetrics' own components can take over those jobs too. vmagent scrapes the same targets, vmalert runs the same rule format, and Grafana queries VictoriaMetrics through its Prometheus data source (FAQ).
Is VictoriaMetrics compatible with PromQL?
Mostly. VictoriaMetrics answers PromQL queries through the Prometheus query API, so Grafana can use its Prometheus data source. MetricsQL changes a few results on purpose. Over a slow counter, increase() can return whole numbers where Prometheus returns fractions, and queries that give NaN in Prometheus can return nothing. Test key dashboards before a switch (MetricsQL).
Which is better, Thanos or Mimir?
Neither is better for every setup. Thanos, under Apache 2.0, runs beside your existing Prometheus servers, and its compactor downsamples old data (Thanos). Grafana Mimir, under AGPLv3, is a separate clustered store that Prometheus writes into, multi-tenant by default (Mimir) and without downsampling (Mimir docs). Both keep data in object storage.
What are the key differences between VictoriaMetrics and InfluxDB?
They differ in storage format and query languages. InfluxDB 3 Core, the open-source release, writes Parquet files to object storage or local disk and answers SQL and InfluxQL (InfluxDB). VictoriaMetrics keeps data on block storage and answers MetricsQL and PromQL. It accepts InfluxDB line protocol, but its FAQ says it doesn't support InfluxQL or Flux (FAQ).
What are the best alternatives to VictoriaMetrics?
No single store is best for every team. Thanos and Grafana Mimir keep Prometheus data long-term in object storage. Cortex, the CNCF project Mimir grew from, is another option (CNCF). Prometheus alone may be enough for one cluster. Managed Prometheus services from AWS, Google Cloud and Azure run the storage for you.
Is there an alternative to Prometheus?
Yes, for each part of it. vmagent can take over scraping, and VictoriaMetrics with vmalert can take over storage and rules. AWS, Google Cloud and Azure sell managed Prometheus-compatible services. SaaS vendors such as Datadog run storage, dashboards and alerting for you. Our Kubernetes monitoring guide compares them.
Related Reading
Related posts
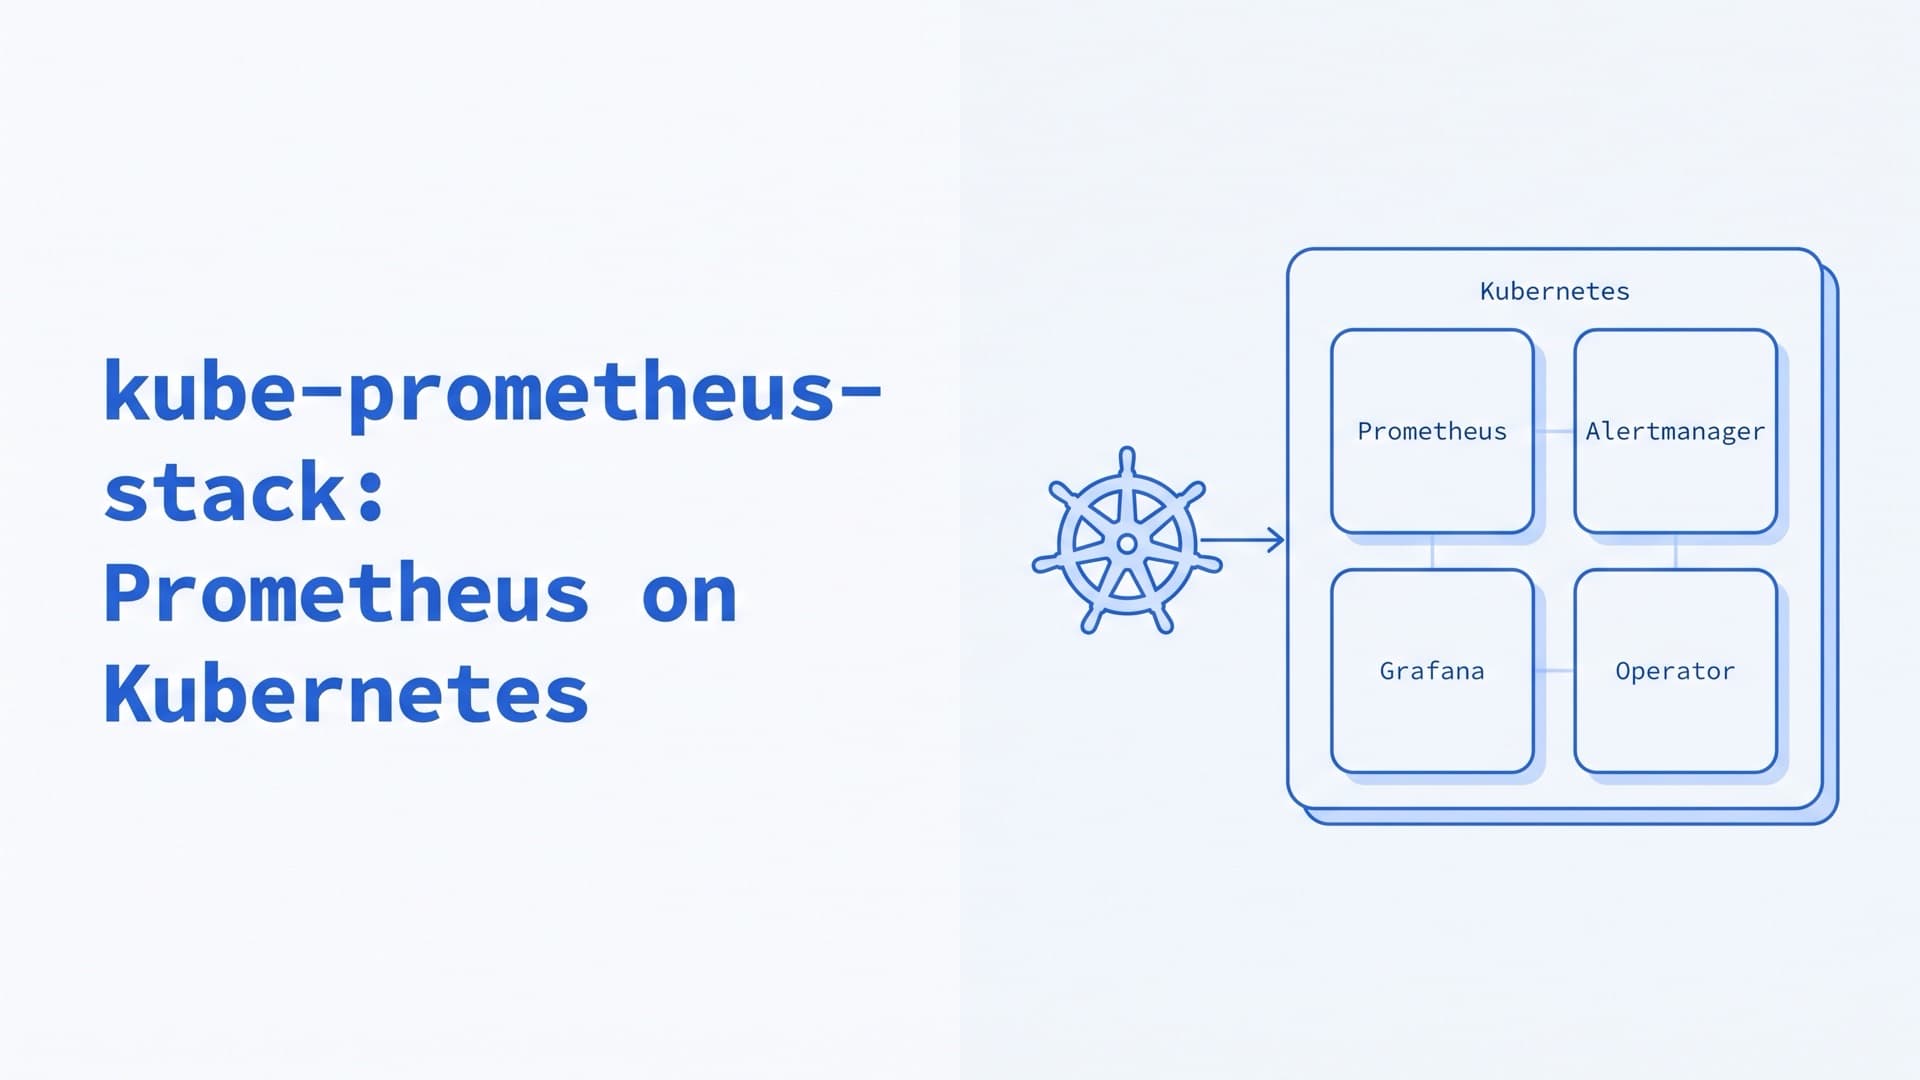
kube-prometheus-stack: Prometheus on Kubernetes
How to run kube-prometheus-stack and the Prometheus Operator in production: Helm values, ServiceMonitors, alerts, CRD upgrades, storage and remote_write.
Kubernetes on Bare Metal: On-Prem Setup and Day 2
How to run Kubernetes on bare metal and on-premise in 2026: provisioning, distributions, HA, load balancing, storage, upgrades, costs and our on-prem work.
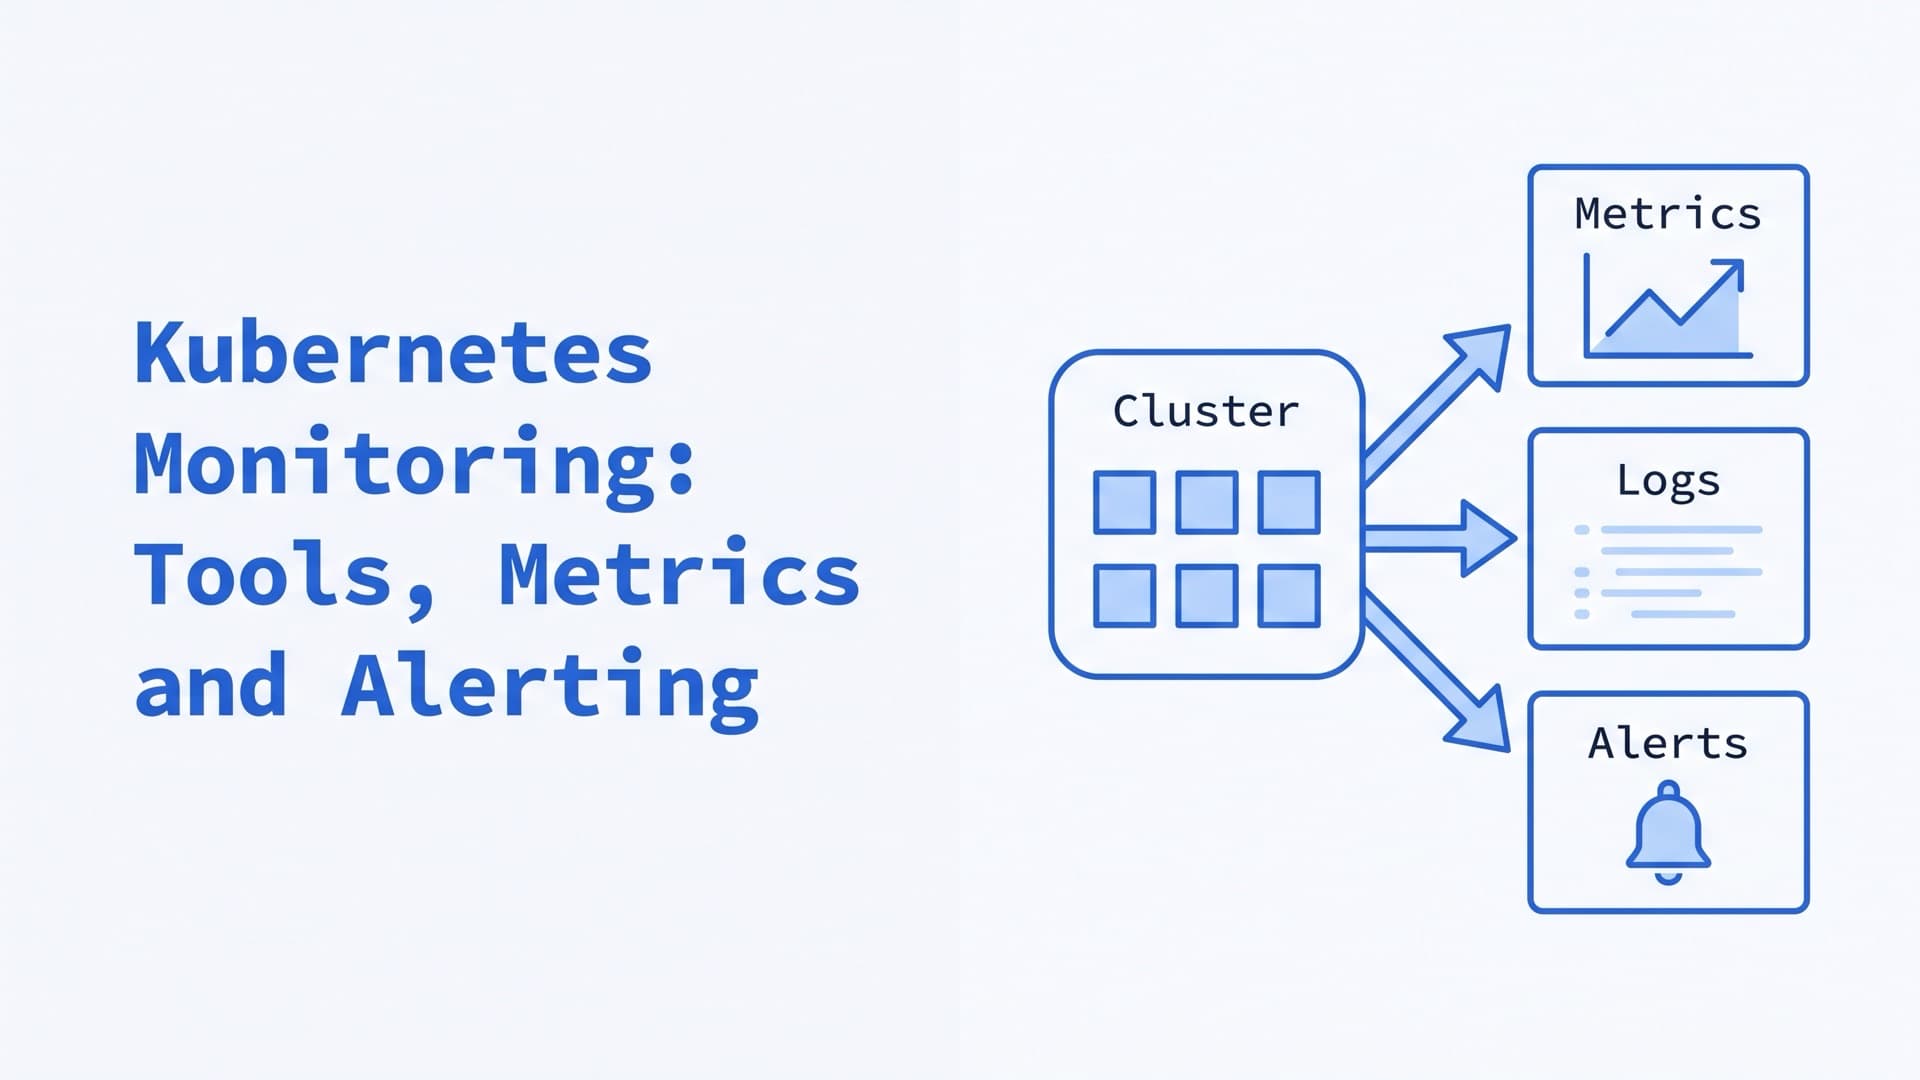
Kubernetes Monitoring: Tools, Metrics and Alerting
How to monitor Kubernetes in 2026: what to watch, where each metric comes from, monitoring and observability tools, alerts, costs, and the stack we run.