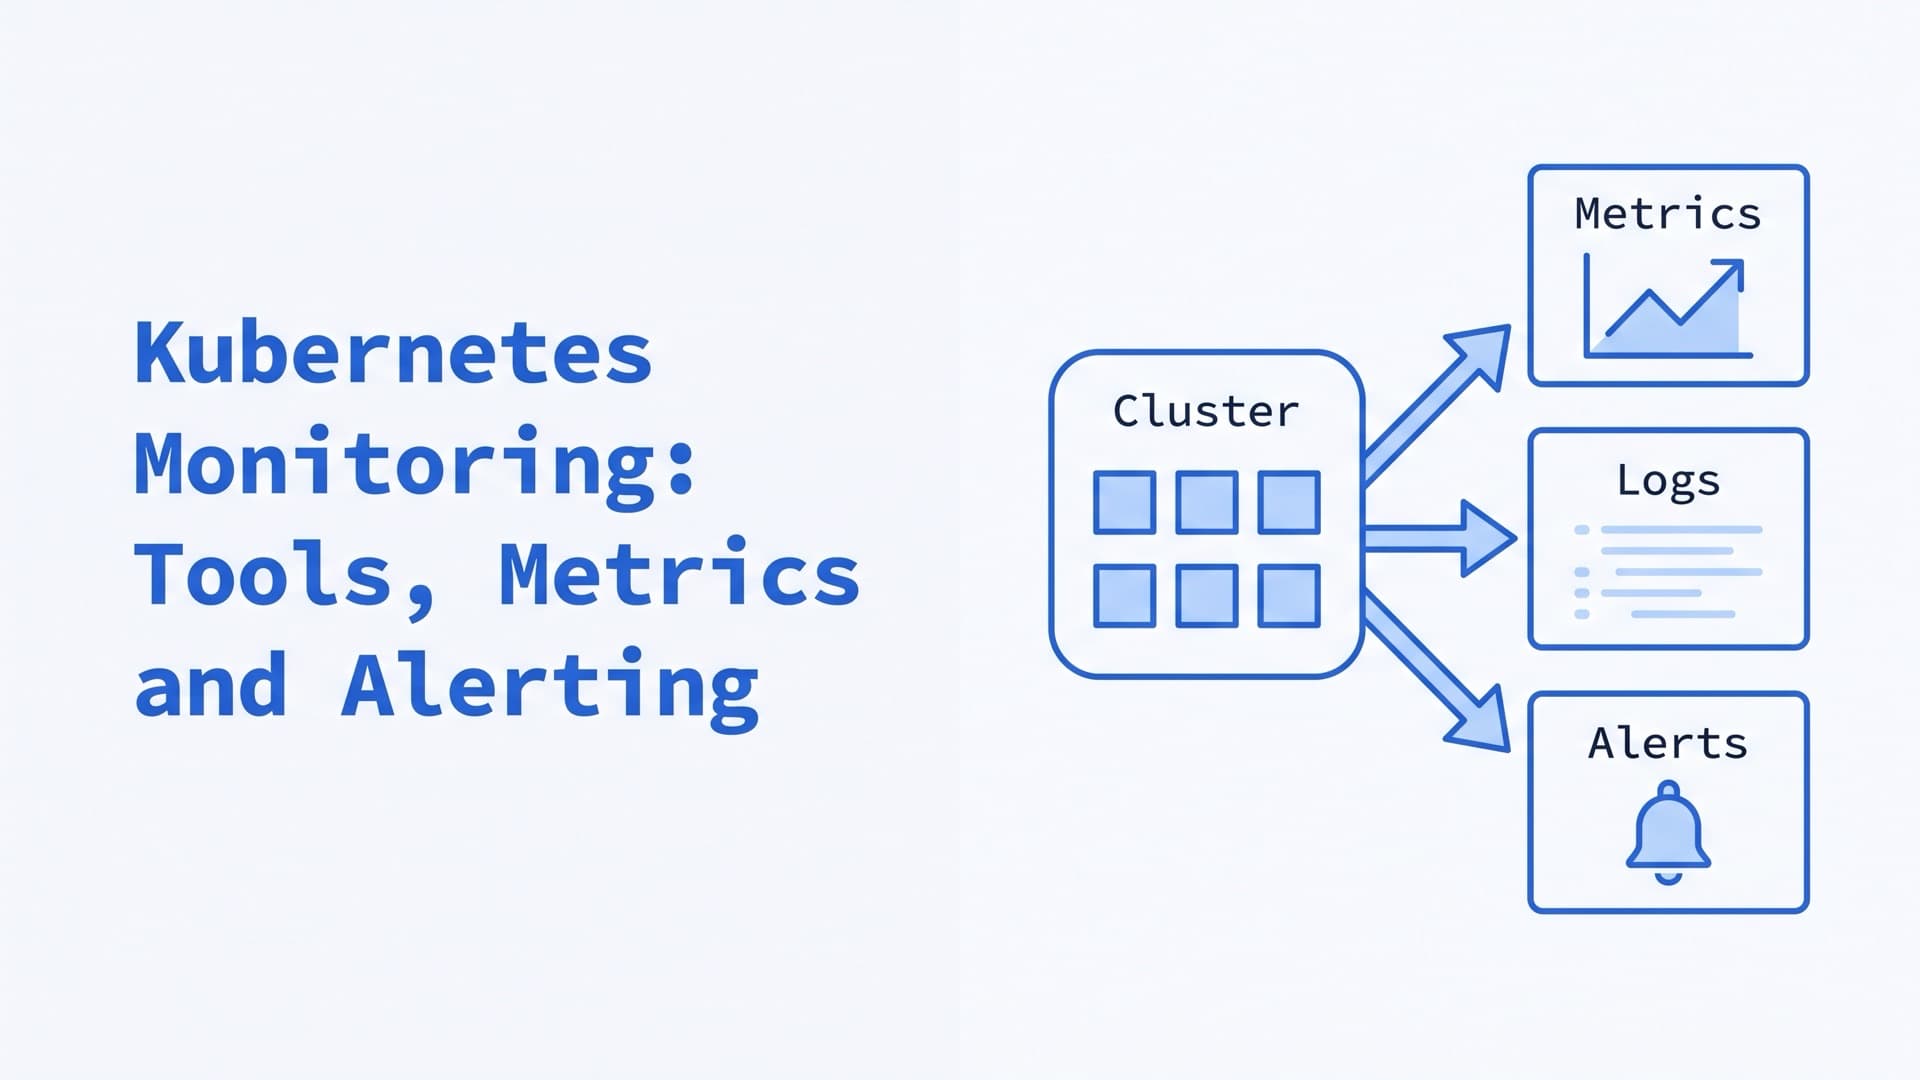
Kubernetes Monitoring: Tools, Metrics and Alerting
What is Kubernetes monitoring?
Kubernetes monitoring means collecting metrics, logs and events from a cluster's control plane, nodes, pods and applications to track their health and performance, and alerting when someone must act. Kubernetes components expose metrics in Prometheus format, but Kubernetes keeps little history of its own. You add a pipeline that scrapes, stores and queries the data.
To monitor a Kubernetes cluster, collect metrics from every layer with a full pipeline such as Prometheus, ship events and logs off the cluster, and alert on user-facing symptoms. This guide ends with how we monitor the clusters we run. It reflects Kubernetes 1.37, the current release, and sources checked in October 2026.
What to monitor in Kubernetes
A fault in one layer often shows up in another. When a node runs short of memory or disk, for example, its kubelet starts failing pods to reclaim resources (node-pressure eviction). So watch every layer, from etcd to your own code. Cluster monitoring covers the control plane and nodes. Pod monitoring covers pods and their containers, and service monitoring covers the requests, errors and latency your users see.
| Layer | Key signals | Main source |
|---|---|---|
| Control plane | API errors and latency, etcd leader, pending pods | Component /metrics |
| Nodes | CPU, memory, disk, Ready and pressure conditions | node-exporter, kube-state-metrics |
| Pods and containers | Restarts, OOM kills, CPU throttling, use against requests | kubelet (cAdvisor), kube-state-metrics |
| Workloads | Desired and available replicas, failed Jobs | kube-state-metrics |
| Applications | Request rate, errors, latency | The app's own metrics |
| Storage | PVC usage and free inodes | kubelet volume stats |
| Network | DNS errors, ingress 4xx and 5xx rate | CoreDNS, ingress controller |
| Events | Warnings such as FailedScheduling | The Kubernetes API |
The metric names behind the table come from each project's docs:
- Control plane. The API server counts requests by response code in
apiserver_request_total, and the scheduler reports waiting pods asscheduler_pending_pods(metrics reference). etcd reports whether it has a leader (etcd metrics). - Storage and network. The kubelet reports PVC usage in its
kubelet_volume_stats_*metrics (metrics reference). CoreDNS counts responses by DNS return code (CoreDNS). Ingress controllers count requests by status code, as Traefik does intraefik_service_requests_total(Traefik). - Applications. Google's SRE book names four golden signals for user-facing systems: latency, traffic, errors and saturation (SRE book). Your services export them through a Prometheus client library or OpenTelemetry.
Security and cost need monitoring of their own. Our Kubernetes security checklist covers the audit log. Our Kubernetes cost monitoring guide covers splitting the cluster bill by namespace and team.
Where Kubernetes metrics come from
The Kubernetes docs describe two metrics pipelines (Tools for Monitoring Resources):
- The resource metrics pipeline serves current CPU and memory use to autoscalers and
kubectl top. metrics-server collects it from each kubelet into a "short-term, in-memory" store. - A full metrics pipeline scrapes the components'
/metricsendpoints and keeps the samples in a time series database, such as Prometheus (Observability).
Monitoring needs the full pipeline. metrics-server's README says it "is meant only for autoscaling purposes" (metrics-server). Our Kubernetes Metrics Server guide covers its setup and how it differs from Prometheus.
A full pipeline reads from these sources:
| Source | What it tells you | Where it runs |
|---|---|---|
| kubelet and cAdvisor | Container CPU, memory, throttling, volume use | Each node's kubelet |
| kube-state-metrics | Object state: replicas, phases, restarts | A Deployment that watches the API |
| node-exporter | Host CPU, memory, disks, network | A DaemonSet on every node |
| Control plane | API server, scheduler, controller manager, etcd | Each component's /metrics |
| Events | Warnings, such as failed scheduling | The API server, one hour by default |
| Logs | What containers write to stdout and stderr | Files on each node |
A few details matter when you wire these up:
- The kubelet serves cAdvisor's container metrics at
/metrics/cadvisor, and its own metrics, volume stats included, at/metrics(system metrics). - Events expire after one hour by default (
--event-ttl). The OpenTelemetry Collector's Kubernetes Objects Receiver can collect them, and the Collector can send them to a log store (OpenTelemetry). - The kubelet rotates container logs at 10 MiB, five files per container by default. Kubernetes has no cluster-level log store of its own (logging).
On EKS, GKE and AKS, the provider runs the control plane and decides which of its metrics you get. EKS serves them through the API and also sends core ones to CloudWatch. GKE sends them through its managed Prometheus service, and AKS offers a free subset as platform metrics, with the rest through managed Prometheus.
Kubernetes monitoring and observability tools
You can run Kubernetes monitoring three ways. You operate an open-source stack, you pay a SaaS vendor, or you use your cloud's managed Prometheus. They differ in what you run yourself and in what makes the bill grow. The Kubernetes docs say the choice "depends heavily on your needs, budget, and technical resources" (Tools for Monitoring Resources).
Open-source Kubernetes monitoring tools
| Tool | What it does |
|---|---|
| Prometheus | Scrapes and stores metrics, runs alert rules |
| Alertmanager | Groups, routes and silences alerts |
| VictoriaMetrics | Prometheus-compatible metrics store, with vmalert for rules |
| Thanos | Long-term, highly available Prometheus storage |
| Grafana Mimir | Scalable Prometheus-compatible storage |
| Grafana | Dashboards and alerts over many data sources |
| Loki | Log store that indexes labels only |
| VictoriaLogs | Log store, single-node or cluster |
| OpenTelemetry Collector | Receives, processes and exports telemetry |
| Zabbix | Host and service monitoring, with Kubernetes templates |
| Nagios Core | Host and service checks run by plugins |
Most tools in this list work with Prometheus, a CNCF graduated project since 2018 (CNCF). OpenTelemetry, graduated in May 2026, covers metrics, logs and traces (CNCF, status). Nagios runs plugins whose return code means OK, WARNING, CRITICAL or UNKNOWN, so any script can become a check (plugin API).
SaaS Kubernetes monitoring solutions
SaaS vendors run storage, dashboards and alerting for you. You install their agent or collector in the cluster, and the bill follows hosts, containers, data or users. The prices below come from each vendor's own pricing page, as of October 2026.
| Product | Bills by | Example list price |
|---|---|---|
| Datadog | Hosts and extra containers, plus log GB and log events | Infrastructure Pro, $15 per host a month, billed annually |
| Grafana Cloud | Active series, GB, users | Pro, from $19 a month plus usage |
| Dynatrace | Pod, host or memory hours, log GiB | Kubernetes Platform Monitoring, $0.002 per pod per hour |
| New Relic | GB ingested, plus users or compute | $0.40 per GB beyond 100 GB a month |
| Elastic | GB ingested and retained | Logs Essentials from $0.07 per GB ingested, Complete from $0.09 |
| Sysdig | Hosts or time series | Quote on request |
Each model grows with something different, as the cost section shows.
Managed Prometheus on AWS, Google Cloud and Azure
Each big cloud sells a managed, Prometheus-compatible metrics store. Scraping still runs in your cluster, through your own agent or a collector the provider manages, and the provider runs storage and queries. All three bill mainly by samples, the individual data points you send.
| Service | Bills by | Retention |
|---|---|---|
| Amazon Managed Service for Prometheus | Samples ingested, GB stored, samples queried | 150 days by default, up to 3 years |
| Google Cloud Managed Service for Prometheus | Samples ingested, plus read requests | 24 months included |
| Azure Monitor managed service for Prometheus | Samples ingested and queried | Up to 18 months included |
As of October 2026, AWS lists $0.90 per 10 million samples for the first 2 billion in US East (Ohio) (AWS pricing). Google lists $0.06 per million samples, or $0.60 per 10 million, for the first 50 billion (Google pricing). Azure lists $0.11 per 10 million samples ingested in East US, plus $0.05 per 10 million samples processed (Azure pricing). Google stores data older than a week at lower resolution (Google docs).
How to choose a Kubernetes monitoring tool
No option is best for every team. Weigh who will run and back up the storage, how much data you produce, how long you must keep it, and where it may live.
We recommend a paid monitoring service when a team has no capacity of its own to store metrics and logs, or when its requirements fit what a paid service offers.
Monitoring Kubernetes with Prometheus and Grafana
Prometheus is an open-source monitoring and alerting toolkit, separate from Kubernetes, and the two fit closely. Kubernetes components expose metrics in Prometheus format. Prometheus discovers scrape targets through the Kubernetes API, "always staying synchronized with the cluster state" (configuration). It stores the samples and evaluates rules, and its docs name Grafana for visualizing the data (overview).
The Prometheus Operator and kube-prometheus-stack
The Prometheus Operator runs Prometheus and Alertmanager from Kubernetes custom resources:
ServiceMonitorandPodMonitorselect Services or pods by label, and the operator turns them into scrape configuration.PrometheusRuleholds alerting and recording rules.
Two projects bundle the operator with node-exporter, kube-state-metrics, Grafana, dashboards and alert rules. kube-prometheus is written in jsonnet. kube-prometheus-stack is a Helm chart, and its README installs it from an OCI registry:
helm install monitoring \
  oci://ghcr.io/prometheus-community/charts/kube-prometheus-stack \
  -n monitoring --create-namespace
The chart leaves out kube-prometheus's Prometheus Adapter and blackbox exporter. Two of its defaults are easy to miss. It keeps 10 days of data, against 15 for Prometheus alone (values.yaml). And its Prometheus picks up only ServiceMonitors that carry the release label, such as release: monitoring (template). This ServiceMonitor scrapes the metrics port of every Service labeled app: my-app in its own namespace (API reference):
apiVersion: monitoring.coreos.com/v1
kind: ServiceMonitor
metadata:
  name: my-app
  labels:
    release: monitoring
spec:
  selector:
    matchLabels:
      app: my-app
  endpoints:
    - port: metrics
      interval: 30s
Retention and long-term storage
Prometheus keeps 15 days of data unless you set --storage.tsdb.retention.time or a size limit (storage). The storage docs warn that local storage "is not clustered or replicated", so you manage it like a single-node database. For high availability, the FAQ suggests two or more identical Prometheus servers, with Alertmanager removing the duplicate alerts (FAQ). kube-prometheus runs two Prometheus replicas this way (manifest).
For longer history, or one view across clusters, Prometheus can remote-write its samples to another store. The Kubernetes docs name Thanos and Cortex for multi-cluster views (Observability), and Mimir and VictoriaMetrics do the same job. In agent mode, Prometheus only scrapes and forwards, with no local queries, rules or alerts (agent mode).
Thanos turns Prometheus into a highly available setup with long-term storage. Grafana Mimir is multi-tenant, horizontally scalable storage (Observability). VictoriaMetrics can serve as long-term storage for Prometheus, and Grafana queries it the way it queries Prometheus (VictoriaMetrics). Its cluster version adds horizontal scaling, multi-tenancy and replication (cluster docs). The VictoriaMetrics operator converts ServiceMonitors, PodMonitors and PrometheusRules into its own objects (operator docs).
Grafana dashboards for Kubernetes
Grafana queries data where it is stored, in sources such as Prometheus, Loki and Elasticsearch, and builds dashboards and alerts on top (Grafana). kube-prometheus-stack ships it with dashboards, many from the kubernetes-mixin project (sync script). Grafana Labs' Kubernetes monitoring Helm chart, k8s-monitoring, collects metrics, logs and traces and sends them to Prometheus, Loki or OTLP endpoints.
Kubernetes alerting
Alert on what users feel. Google's SRE book splits monitoring questions into symptoms, "what's broken", and causes, "why" (SRE book). In its examples, serving HTTP 500s is a symptom, and database servers refusing connections is a cause. The book also says "Every page should be actionable". A page that needs only a robotic response shouldn't be a page.
Alerts every Kubernetes cluster needs
In our setup, every cluster needs alerts on four things. Each maps to a public rule or tool you can start from.
| Alert on | Start from | Source |
|---|---|---|
| Cluster and etcd health | KubeAPIDown, KubeNodeNotReady, etcdNoLeader | kubernetes-mixin, etcd mixin |
| Core services, such as the load balancer and DNS | Probes of the endpoints clients use | blackbox exporter |
| PVC usage | KubePersistentVolumeFillingUp | kubernetes-mixin |
| Ingress 4xx and 5xx rate | Errors as a share of all requests | Your controller's metrics |
What those rules do:
KubeAPIDownfires when the API server has been missing from Prometheus's target discovery for 15 minutes. An API server that is discovered but unreachable firesKubeAPIInstanceUnreachable, a warning, after 15 minutes (absent_alert.libsonnet, instance_unreachable_alert.libsonnet).etcdNoLeaderfires when an etcd member has had no leader for more than a minute (etcdNoLeader).KubePersistentVolumeFillingUpwarns when a volume has less than 15% free and is predicted to fill within four days. It turns critical below 3% free (storage_alerts.libsonnet).
kube-prometheus also ships Watchdog, an alert that always fires. Route it to an outside service that alerts you when it stops arriving, so you learn the alert pipeline itself is broken (Watchdog runbook). Our CrashLoopBackOff guide walks through KubePodCrashLooping and the crashes it misses.
Severity, routing and runbooks
Alertmanager takes alerts from Prometheus or vmalert, removes duplicates, groups them and routes them to receivers. It can also silence alerts, or mute them while a bigger alert fires (Alertmanager).
We sort alerts into three severity levels, by how soon someone must fix the cause:
- Warning means fix within a few days.
- Critical means fix within a few hours.
- Emergency means fix as soon as possible.
Every alert has an instruction in our wiki, and a check stops anyone from adding an alert without one. kubernetes-mixin follows the same idea. It adds a runbook_url annotation to every alert that lacks one (add-runbook-links.libsonnet), and kube-prometheus points those links at its runbooks site.
We wanted on-call to follow our own team calendar, and one screen that shows the current state of every alert. PagerDuty and Opsgenie didn't fit that workflow, so we run our own in-house alerting tool.
Keep pages rare. The SRE book notes that a person can react with urgency only a few times a day before fatigue sets in. Review the alerts that fired without needing action, then fix or delete them. When an alert does need action, our troubleshooting guide maps symptoms to first commands.
If your alerts wake people for nothing or miss real outages, our Kubernetes consulting team starts with read-only access and a written list of what to fix first.
Kubernetes observability: logs and traces
Kubernetes observability means collecting and analyzing metrics, logs and traces, which the Kubernetes docs call "the three pillars of observability" (Observability). DORA's research separates it from monitoring. Monitoring lets teams watch the state of their systems, based on "predefined sets of metrics or logs". Observability lets them debug by exploring "properties and patterns not defined in advance" (DORA).
Logs. Containers write to stdout and stderr, and the container runtime saves that output to files on the node. Most clusters run a node-level agent, such as Fluent Bit, that ships those files to a central store (Observability). Loki indexes only metadata, a set of labels for each log stream, and leaves the log text unindexed. VictoriaLogs takes logs from Fluent Bit, Vector, the OpenTelemetry Collector and other agents. Elasticsearch and OpenSearch index logs for search (Observability), and our OpenSearch vs Elasticsearch comparison covers how the two differ.
Traces. A trace follows one request across services and shows how long each step took. Traces matter most when a request crosses many services, because metrics alone don't show which one was slow. The API server and the kubelet can export their own spans over OTLP, a stable feature since Kubernetes 1.34 (v1.34 release, system traces). OpenTelemetry provides the SDKs and the Collector, which sends telemetry to open-source or commercial backends. Jaeger and Grafana Tempo are open-source trace stores.
eBPF tools collect some of this without code changes. OpenTelemetry eBPF Instrumentation (OBI), donated from Grafana's Beyla, adds zero-code instrumentation through eBPF. It is still in development, and its README warns of breaking changes while it stays at v0. A 1.0 release candidate came out on October 7, 2026 (OBI, v1.0.0-rc.1).
What Kubernetes monitoring costs
The cost of monitoring grows with the number of time series, how often you sample them and how long you keep them.
Series. Every unique combination of labels is a separate time series (data model). Prometheus warns against labels with many values, "such as user IDs, email addresses, or other unbounded sets of values" (naming). In Kubernetes, the pod label changes with each deployment, so every rollout starts new series (VictoriaMetrics FAQ).
Samples and retention. Prometheus stores an average of 1 to 2 bytes per sample, and its docs give this formula for disk space (storage):
needed_disk_space =
  retention_time_seconds
  * ingested_samples_per_second
  * bytes_per_sample
The docs add that cutting series usually saves more than a longer scrape interval, because samples within a series compress well.
Downsampling keeps old data at lower resolution, so queries over months run fast. Thanos's docs say it doesn't save space, and keeping all resolutions can make storage about three times larger (Thanos compactor). In VictoriaMetrics, downsampling is an Enterprise feature (Enterprise features).
Limits. Limits stop one bad target from flooding storage:
- Prometheus fails the whole scrape when a target exceeds
sample_limitorlabel_limit. Both are off by default (configuration). - The Prometheus Operator's
enforcedSampleLimitsets a global sample limit that overrides higher limits on ServiceMonitors, PodMonitors and Probes (API reference). - vmagent limits series per target with
-promscrape.seriesLimitPerTargetorseries_limit(vmagent). vmagent and VictoriaMetrics storage can also cap new series per hour and per day (VictoriaMetrics).
Paid services. Vendors price the same numbers in different ways:
- Datadog counts each Kubernetes node as a host. It bills the month's highest hourly host count, after dropping the top 1% of hours (billing docs). Pro includes 5 containers per host, and Datadog bills each extra container at $0.002 an hour (pricing, containers).
- Grafana Cloud bills metrics on active series and data points per minute. Pro includes one data point per minute per series, so a shorter scrape interval costs extra (metrics billing). Its Kubernetes Monitoring adds host and container hours (Kubernetes billing).
- AWS, Google and Azure bill by samples, and New Relic and Elastic by GB.
Count your series, samples and log volume before you compare quotes.
Kubernetes monitoring best practices
- Watch every layer, from etcd to your apps' golden signals.
- Use metrics-server for autoscaling only, and a full pipeline for monitoring.
- Alert on symptoms users feel, and make every page actionable.
- Give every alert a severity and a written instruction.
- Alert on the alert pipeline itself, as
Watchdogdoes. - Cover cluster and etcd health, DNS, the load balancer, PVC usage and ingress errors.
- Set scrape limits, and review your series count every week.
- Choose retention on purpose. Prometheus's local storage is limited to one node's scale and durability, so plan where years of history will live and how they are backed up.
- Ship events and logs off the cluster.
- Price paid tools against your own series, samples and GB.
How we monitor Kubernetes
This is how we monitor the clusters we run.
Metrics. Prometheus, run by the Prometheus Operator that ships with Rancher's monitoring chart, collects metrics, and VictoriaMetrics stores them. We moved storage from Prometheus to VictoriaMetrics because Prometheus on its own has no clustering or built-in high availability (storage, FAQ). We keep metrics for two years. In all, we have about 6 million time series and about 7 trillion stored data points.
Logs, traces and checks. Logs go to VictoriaLogs, and we don't collect traces. We dropped Zabbix long ago in favor of VictoriaMetrics. We still use Nagios for incident alerting and custom checks, because not every check is easy to write in PromQL. We use no paid monitoring service.
Metric volume. We track metric volume as inserts per minute and review it every week. In one case, an application with its own exporter wrote metrics to a file every 10 seconds, and each write created a new set of metrics. A week later there were more than half a million metrics, each scraped every 10 seconds. The weekly review found it, and it was fixed.
Manual review works for us because we add most metrics ourselves. Other teams may need the limits above enforced in software. To find the source of a jump, Prometheus records scrape_samples_scraped and scrape_series_added for every target (jobs and instances).
The problems we find most often:
- single points of failure;
- badly set resource requests and limits, which our performance guide covers;
- a huge number of metrics that nobody understands or acts on;
- logs that are either too detailed to search or too thin to help;
- application architecture, from the choice of language to how the app is spread across regions.
New clusters. For a new cluster, we would start from the VictoriaMetrics operator.
AI agents. Our SRE team's AI agents read Grafana and VictoriaLogs through third-party MCP servers, as our AI SRE guide shows.
We have run production systems since 2009 and have managed more than 1,350 production servers. If you'd rather not build monitoring alone, our Kubernetes consulting team starts with read-only access and a written list of what to fix first. We can also run your clusters afterwards. On-call is by agreement, with up to 24-hour coverage under an SLA, and post-incident reviews are part of on-call work.
Frequently Asked Questions
What is the best monitoring tool for Kubernetes?
No tool is best for every cluster. Prometheus and Grafana are free and open source, but you run them yourself, with VictoriaMetrics, Thanos or Mimir for long-term storage. Datadog, Grafana Cloud, Dynatrace, New Relic and Elastic sell hosted platforms, and AWS, Google and Azure sell managed Prometheus. Choose by who runs storage, your data volume and how each product bills.
Is Prometheus part of Kubernetes?
No. Prometheus is a separate open-source project that joined the CNCF in 2016, after Kubernetes (overview). The two work closely together. Kubernetes components expose metrics in Prometheus format, and Prometheus finds its scrape targets through the Kubernetes API. You install Prometheus yourself, often with the Prometheus Operator or the kube-prometheus-stack Helm chart.
How to check PVC usage in Kubernetes?
kubectl top shows only CPU and memory, so read the kubelet's volume metrics. It exports kubelet_volume_stats_used_bytes and kubelet_volume_stats_capacity_bytes for each PersistentVolumeClaim (metrics reference). Query them in Prometheus. Without a monitoring stack, kubectl get --raw /api/v1/nodes/<node>/proxy/stats/summary returns a node's volume stats (node metrics).
Is observability a part of DevOps?
Yes. DORA, a research program run by Google Cloud, studies the capabilities that drive software delivery and operations performance. It lists monitoring and observability among its core capabilities. Its research found that a comprehensive monitoring and observability solution contributes to continuous delivery (DORA). DORA also advises against confining monitoring to a single person or team.
What are the top 3 observability tools?
There is no agreed top three. A typical open-source stack has one store per signal, such as Prometheus or VictoriaMetrics for metrics, Loki, VictoriaLogs or Elasticsearch for logs, and Jaeger or Grafana Tempo for traces. OpenTelemetry collects all three. SaaS products such as Datadog, Dynatrace and New Relic run the storage for you.
Related Reading
Related posts
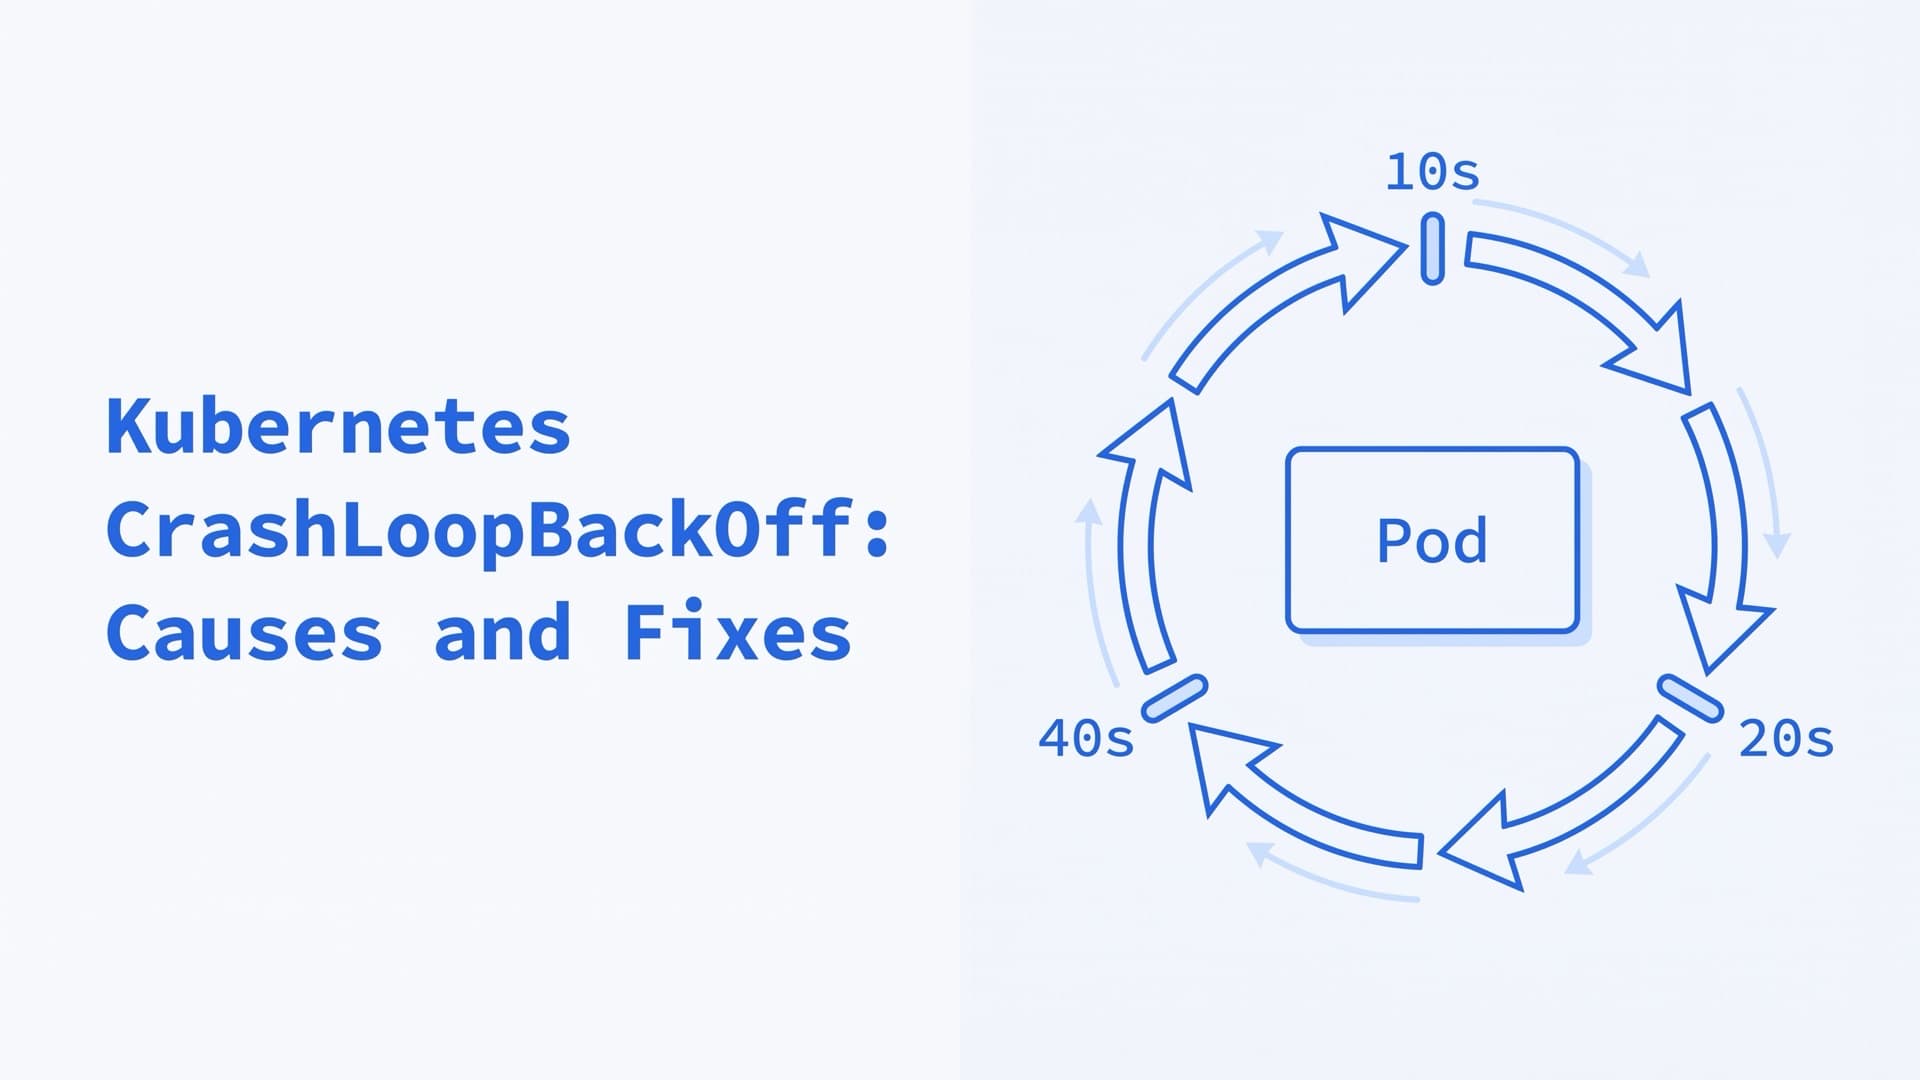
Kubernetes CrashLoopBackOff: Causes and Fixes
What CrashLoopBackOff and "Back-off restarting failed container" mean in Kubernetes 1.37, how long the backoff lasts, and how to debug and fix the cause.
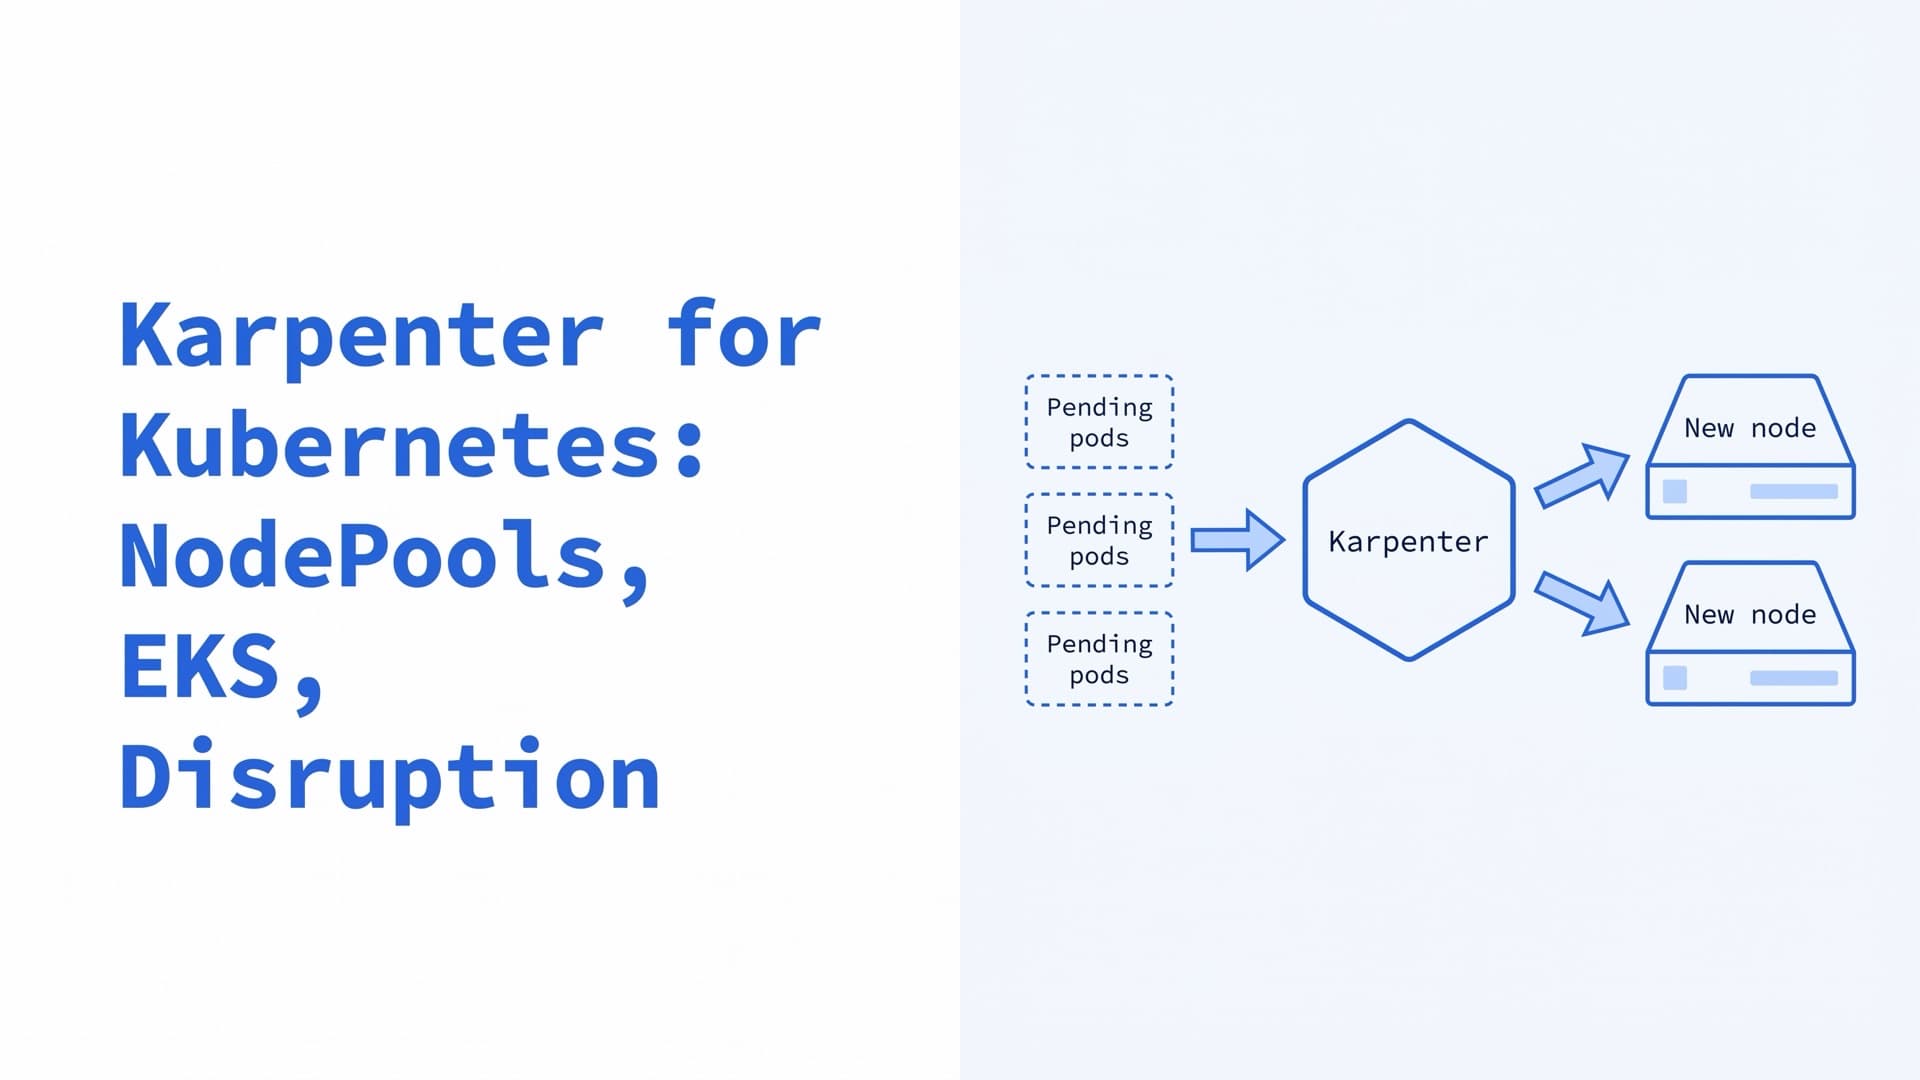
Karpenter for Kubernetes: NodePools, EKS, Disruption
How Karpenter scales Kubernetes nodes in 2026: NodePool and EC2NodeClass YAML, EKS install, Auto Mode, disruption, Cluster Autoscaler migration and fixes.
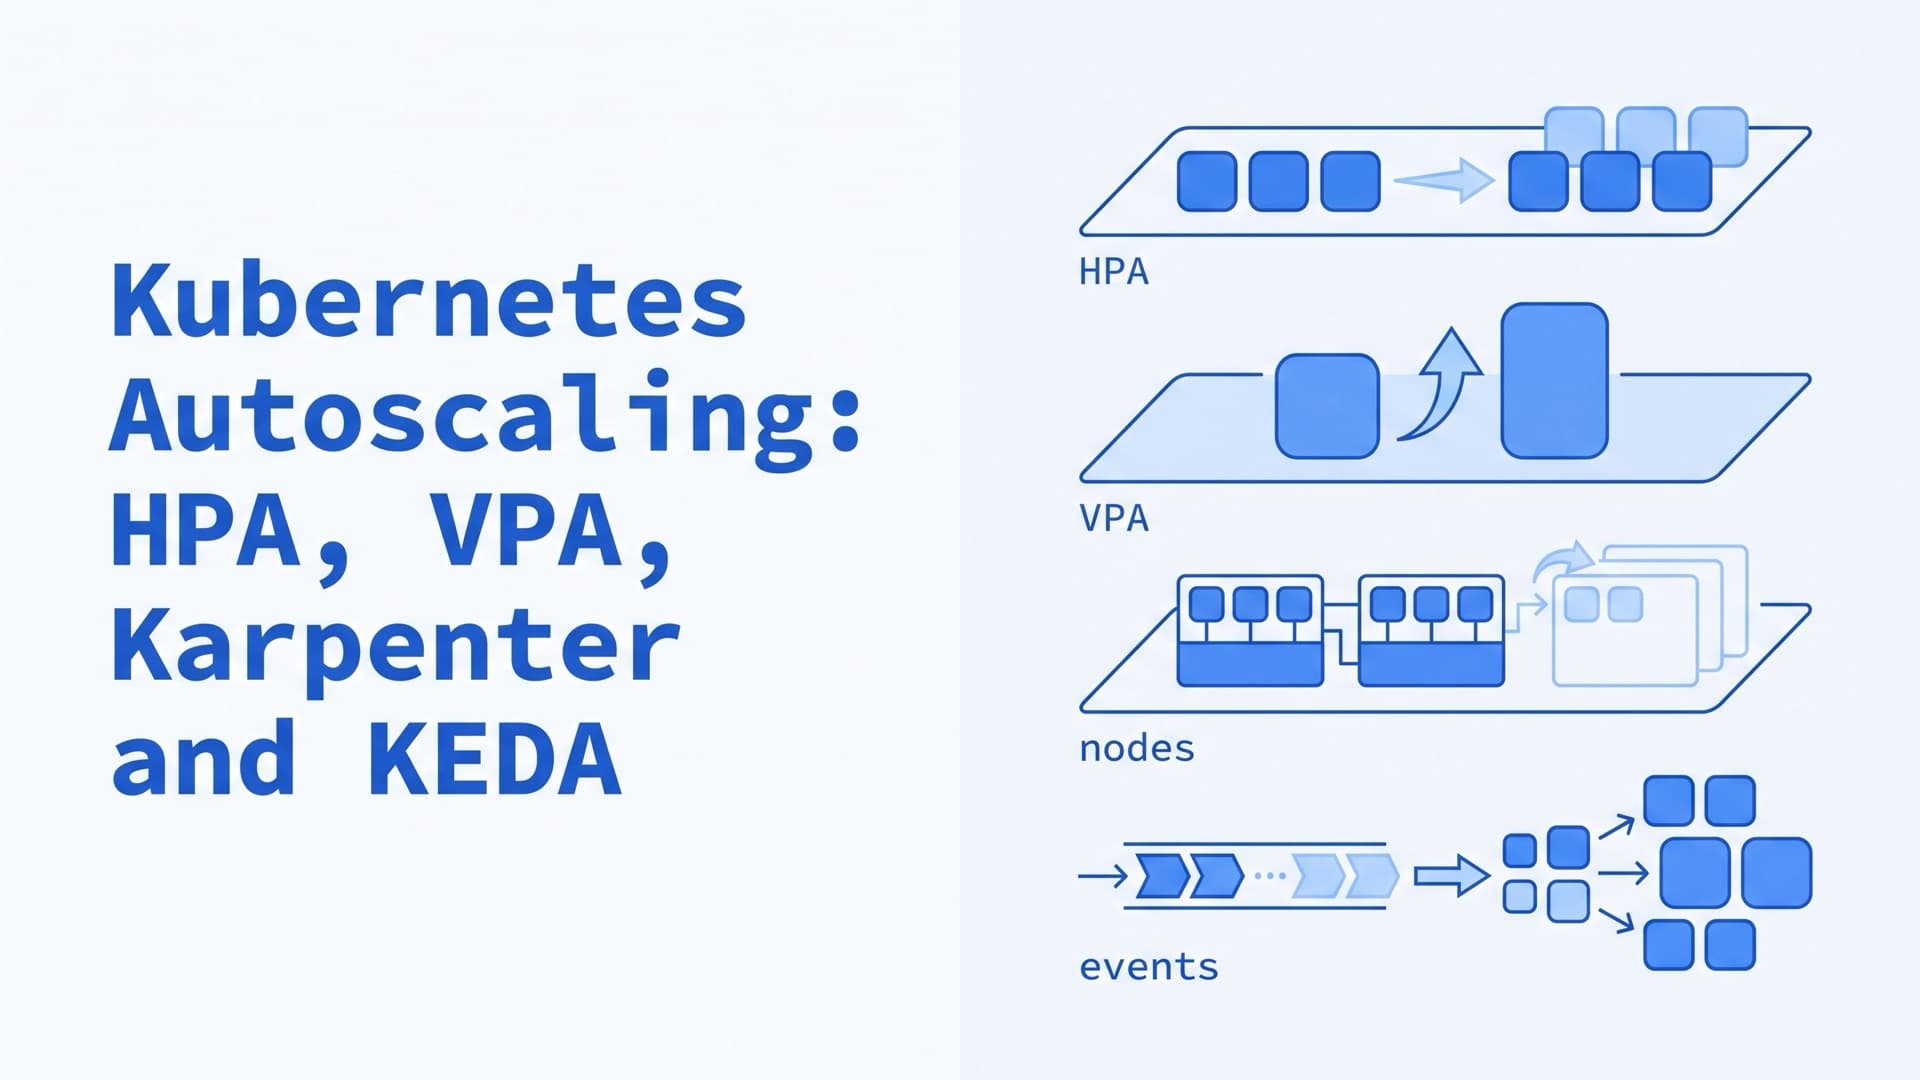
Kubernetes Autoscaling: HPA, VPA, Karpenter and KEDA
How Kubernetes autoscaling works in 2026: HPA and scale to zero, VPA in-place resize, Cluster Autoscaler, Karpenter, KEDA, YAML examples and fixes.