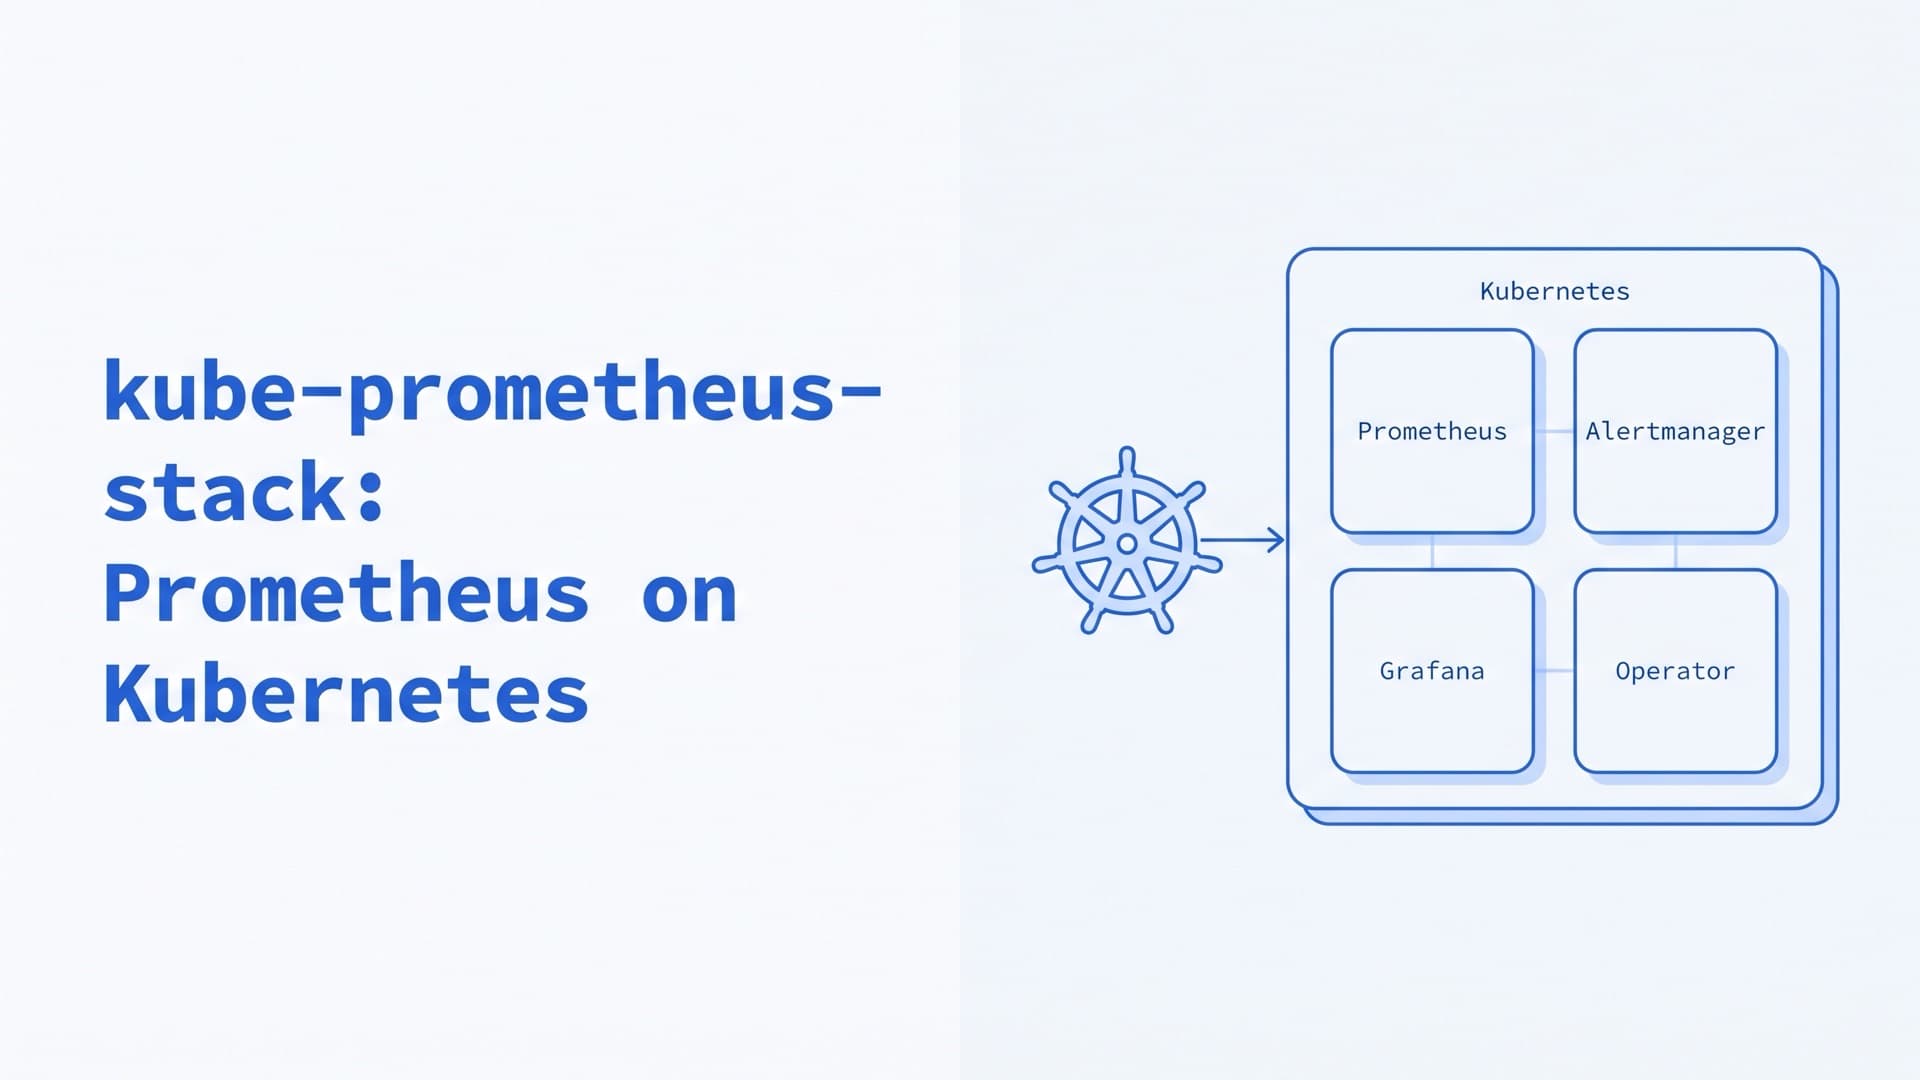
kube-prometheus-stack: Prometheus on Kubernetes
What is kube-prometheus-stack?
kube-prometheus-stack is a Helm chart from the prometheus-community project that installs Prometheus monitoring on Kubernetes. It deploys the Prometheus Operator, Prometheus, Alertmanager, Grafana, node-exporter and kube-state-metrics, with dashboards and alert rules for the cluster already set up (README). Version 92.7.0 was the newest release on October 15, 2026.
Chart 92.7.0 came out on October 14, 2026. It runs Prometheus Operator v0.94.1, Prometheus v3.15.0 and Alertmanager v0.34.1 (Chart.yaml, values.yaml, L1034). Its subcharts add Grafana 13.2.4, kube-state-metrics 2.20.0 and node-exporter 1.12.1 (Grafana, kube-state-metrics, node-exporter). The chart was once named prometheus-operator.
This guide to monitoring Kubernetes with Prometheus covers the install and what matters in production: CRD upgrades, ServiceMonitor selection, control-plane targets on managed clusters, disk, high availability and long-term storage. It ends with how we run Prometheus and keep two years of metrics. It reflects Kubernetes 1.37, the current release, and sources checked in October 2026. For what to monitor and how to choose tools, see our Kubernetes monitoring guide.
How Prometheus works in Kubernetes
Prometheus is an open-source monitoring and alerting toolkit, separate from Kubernetes (overview). Our monitoring guide explains how the two relate. Prometheus pulls metrics over HTTP from each target, stores them as time series and evaluates rules. On Kubernetes, it finds targets through the Kubernetes API, "always staying synchronized with the cluster state" (configuration).
What is the Prometheus Operator?
The Prometheus Operator deploys and manages Prometheus, Alertmanager and related components from Kubernetes custom resources (introduction). You declare an instance and what it should scrape, and the operator writes the Prometheus configuration. Plain Prometheus lists its targets in a scrape configuration file, with relabeling rules to filter them. The operator lets you use Kubernetes label selectors instead (introduction). For each Prometheus resource, it creates one StatefulSet per shard (design).
Prometheus Operator CRDs
The operator defines ten custom resources in the monitoring.coreos.com group. In the CRDs the chart installs, three are still alpha APIs (CRDs, design):
| Resource | API version | What it does |
|---|---|---|
| Prometheus | v1 | Runs Prometheus servers |
| PrometheusAgent | v1alpha1 | Runs Prometheus in agent mode |
| Alertmanager | v1 | Runs Alertmanager |
| ThanosRuler | v1 | Runs Thanos Ruler for rules |
| ServiceMonitor | v1 | Scrapes pods behind a Service |
| PodMonitor | v1 | Scrapes pods directly |
| Probe | v1 | Probes targets through an exporter |
| ScrapeConfig | v1alpha1 | Any scrape job, even outside the cluster |
| PrometheusRule | v1 | Alerting and recording rules |
| AlertmanagerConfig | v1alpha1 | Alert routes and receivers |
Prometheus and Alertmanager resources pick up the others through label selectors. An empty selector, {}, matches every object. A missing selector matches none, and a missing namespace selector matches only the instance's own namespace (design). The operator doesn't discover targets from prometheus.io/scrape annotations, so use a ServiceMonitor or PodMonitor instead (README).
kube-prometheus-stack vs kube-prometheus vs the prometheus chart
Three projects package Prometheus for Kubernetes. Two of them, kube-prometheus-stack and kube-prometheus, run the operator and ship Grafana. Their READMEs and default manifests show where those two differ (README, values.yaml, manifests):
| kube-prometheus-stack | kube-prometheus | |
|---|---|---|
| Format | Helm chart | jsonnet, manifests |
| Installs with | helm install | kubectl apply |
| Prometheus replicas | 1 | 2 |
| Alertmanager replicas | 1 | 3 |
| Adapter, blackbox exporter | No | Yes |
kube-prometheus v0.19.0 supports Kubernetes 1.35 to 1.37. Its Prometheus Adapter serves the same resource metrics API as metrics-server. Its README warns that "everything is experimental and may change significantly at any time".
The standalone prometheus chart, version 29.37.0, runs Prometheus without the operator. It scrapes pods and other objects that carry prometheus.io/scrape annotations, and it bundles Alertmanager, kube-state-metrics, node-exporter and Pushgateway, with no Grafana. Choose kube-prometheus-stack if you deploy with Helm, and kube-prometheus if you already build manifests in jsonnet. Argo CD can deploy either (Argo CD).
How to install the kube-prometheus-stack Helm chart
You need three things first:
- Kubernetes 1.25 or newer. The README still lists 1.19, but the chart's
kubeVersionfield makes Helm refuse older clusters (Chart.yaml). - Helm 3 or newer (README). Helm 4.3.1 was the newest release on October 15, 2026.
- A StorageClass that provisions volumes, so Prometheus can keep its data (storage).
A kube-prometheus-stack values.yaml to start from
The defaults suit a test cluster. Prometheus stores data on an emptyDir volume, which isn't kept when the pod is redeployed (storage). One Prometheus and one Alertmanager run, and Prometheus keeps 10 days of data (values.yaml). The chart sets no resource requests, and the operator adds only a 200Mi memory request to Alertmanager (statefulset.go). This values.yaml changes that:
prometheus:
  prometheusSpec:
    retention: 15d
    retentionSize: 40GiB
    storageSpec:
      volumeClaimTemplate:
        spec:
          accessModes:
            - ReadWriteOnce
          resources:
            requests:
              storage: 50Gi
    replicas: 2
    podAntiAffinity: hard
    externalLabels:
      cluster: prod-eu1
alertmanager:
  alertmanagerSpec:
    replicas: 3
What each setting does:
retentionandretentionSizedelete data older than 15 days or beyond 40 GiB, whichever comes first. The Prometheus docs advise a size limit of at most 80 to 85% of the disk, to leave room for compaction (storage).storageSpecgives each Prometheus pod its own 50 GiB PersistentVolumeClaim (storage). Avoid NFS, including AWS EFS, which Prometheus doesn't support (storage).replicas: 2withpodAntiAffinity: hardruns two identical Prometheus servers on separate nodes, the chart's basic HA setup (README).externalLabelsadds aclusterlabel to every sample Prometheus sends out, so a shared store can tell clusters apart (VictoriaMetrics).- Alertmanager
replicas: 3forms a cluster that shares silences and notification logs (high availability).
Install the chart from its OCI registry, as the README does:
helm install monitoring \
  oci://ghcr.io/prometheus-community/charts/kube-prometheus-stack \
  --version 92.7.0 \
  -n monitoring --create-namespace \
  -f values.yaml
Pin --version. The chart bumps its major version when its CRDs change, and CRD upgrades need a manual step (README). The release name, monitoring, also becomes the release label that the chart's Prometheus looks for.
How to access Grafana and Prometheus
The chart creates no Ingress by default (values.yaml), so start with port forwarding:
kubectl -n monitoring port-forward \
  svc/monitoring-grafana 3000:80
Open localhost:3000 and log in as admin. The Grafana subchart generates a random 40-character password and stores it in the monitoring-grafana Secret (_helpers.tpl). The chart's own notes read it like this (NOTES.txt):
kubectl -n monitoring get secret \
  monitoring-grafana \
  -o jsonpath="{.data.admin-password}" \
  | base64 --decode; echo
To set the password yourself, point grafana.admin.existingSecret at your own Secret (values.yaml). For Prometheus, forward svc/prometheus-operated to port 9090, as the operator's docs do (troubleshooting). Alertmanager answers on port 9093 of svc/monitoring-kube-prometheus-alertmanager (values.yaml).
What kube-prometheus-stack installs
| Component | Runs as | What it gives you |
|---|---|---|
| Prometheus Operator | Deployment | Turns custom resources into config |
| Prometheus | StatefulSet | Scrapes, stores, evaluates rules |
| Alertmanager | StatefulSet | Groups and routes alerts |
| Grafana | Deployment | Dashboards |
| kube-state-metrics | Deployment | Object state, such as replicas |
| node-exporter | DaemonSet | Host CPU, memory, disk, network |
The operator creates the two StatefulSets from the chart's Prometheus and Alertmanager resources (design). With default values, helm template of chart 92.7.0 renders 13 ServiceMonitors, 35 PrometheusRule objects holding 139 distinct alerts, and 29 dashboard ConfigMaps.
How to scrape your apps with ServiceMonitor and PodMonitor
Your app needs a metrics endpoint in Prometheus format first. Our Go guide shows one built with the Prometheus client library. Then describe the target with one of the resources below.
ServiceMonitor example
A ServiceMonitor scrapes the pods behind a Service. It refers to the Service port by name, so that port must have one (troubleshooting):
apiVersion: v1
kind: Service
metadata:
  name: my-app
  labels:
    app: my-app
spec:
  selector:
    app: my-app
  ports:
    - name: metrics
      port: 8080
apiVersion: monitoring.coreos.com/v1
kind: ServiceMonitor
metadata:
  name: my-app
  labels:
    release: monitoring
spec:
  selector:
    matchLabels:
      app: my-app
  endpoints:
    - port: metrics
      interval: 30s
This ServiceMonitor selects Services labeled app: my-app in its own namespace and scrapes their metrics port every 30 seconds. Prometheus sets the job label to the Service name. To watch other namespaces, add spec.namespaceSelector with matchNames, or with any: true (API reference). The release: monitoring label lets the chart's Prometheus find it.
PodMonitor and ScrapeConfig examples
A PodMonitor scrapes pods directly, for workloads without a Service. Its port is the name of a container port (API reference):
apiVersion: monitoring.coreos.com/v1
kind: PodMonitor
metadata:
  name: my-worker
  labels:
    release: monitoring
spec:
  selector:
    matchLabels:
      app: my-worker
  podMetricsEndpoints:
    - port: metrics
A ScrapeConfig covers targets outside the cluster, or discovery that the monitors can't express. Its API is still v1alpha1 (ScrapeConfig):
apiVersion: monitoring.coreos.com/v1alpha1
kind: ScrapeConfig
metadata:
  name: legacy-hosts
  labels:
    release: monitoring
spec:
  staticConfigs:
    - targets:
        - 10.0.0.15:9100
        - 10.0.0.16:9100
ServiceMonitor not showing up in Prometheus
The chart's Prometheus loads monitors from every namespace, but only those labeled release with the release name (template). The same rule applies to PodMonitors, Probes, ScrapeConfigs and PrometheusRules. When a target is missing, work down this table, built from the operator's troubleshooting guide:
| Symptom | Likely cause | Check |
|---|---|---|
| Not in the config | No release label | kubectl get servicemonitor -A -L release |
| Not in the config, event logged | Operator rejected it | kubectl get events for the object |
| In the config, no targets | Selector matches no Service | kubectl get svc -l app=my-app |
| No targets | Service in another namespace | spec.namespaceSelector |
| No targets | Service port has no name | ports[].name on the Service |
| Targets down | Wrong path, port or TLS | /targets in the Prometheus UI |
A port number in endpoints[].port fails validation, because the field takes the port's name (troubleshooting). Rejected objects also fire the chart's PrometheusOperatorRejectedResources alert (troubleshooting). To see whether the operator picked up a monitor, search the configuration it generated. It sits in a Secret named after the Prometheus resource, with a prometheus- prefix (troubleshooting):
kubectl -n monitoring get secret \
  prometheus-monitoring-kube-prometheus-prometheus \
  -o jsonpath='{.data.prometheus\.yaml\.gz}' \
  | base64 -d | gunzip | grep my-app
To drop the label requirement, let the selectors match everything, as the README suggests for third-party monitors (README):
prometheus:
  prometheusSpec:
    serviceMonitorSelectorNilUsesHelmValues: false
    podMonitorSelectorNilUsesHelmValues: false
    ruleSelectorNilUsesHelmValues: false
Prometheus then loads every ServiceMonitor, PodMonitor and PrometheusRule in the cluster. Probes and ScrapeConfigs keep the label rule unless you also set probeSelectorNilUsesHelmValues and scrapeConfigSelectorNilUsesHelmValues to false (values.yaml). That suits a cluster with one Prometheus.
kube-prometheus-stack alerts and Alertmanager
Default alert rules
Many of the chart's rules and dashboards come from the kubernetes-mixin project, through kube-prometheus (kube-prometheus README). You can switch off a rule group under defaultRules.rules and a single alert under defaultRules.disabled. Change an alert's for or severity under customRules (values.yaml). Every alert carries a runbook_url that points at the runbooks site, though some newer alerts, such as KubeAPIInstanceUnreachable, have no page there yet. Our monitoring guide explains KubeAPIDown, Watchdog and the alerts every cluster needs.
How to configure Alertmanager in kube-prometheus-stack
The chart's default Alertmanager config sends every alert to a receiver named null, which has no integrations (values.yaml). Until you change it, alerts fire in Prometheus and reach no one. These values make Slack the default receiver and send Watchdog to a heartbeat service:
alertmanager:
  alertmanagerSpec:
    secrets:
      - am
  config:
    route:
      receiver: slack
      routes:
        - receiver: heartbeat
          matchers:
            - alertname = "Watchdog"
          repeat_interval: 5m
    receivers:
      - name: slack
        slack_configs:
          - api_url_file: >-
              /etc/alertmanager/secrets/am/slack
      - name: heartbeat
        webhook_configs:
          - url_file: >-
              /etc/alertmanager/secrets/am/ping
How it works:
secretsmounts theamSecret at/etc/alertmanager/secrets/am, so webhook URLs stay out of your values file (API reference). The Secret holds two keys,slackandping.api_url_fileandurl_fileread each URL from its file (configuration).- Slack posts to the channel picked when the webhook was created. An incoming webhook can't override it (Slack).
routesandreceiversreplace the chart's lists, which removes thenullroute and receiver. Helm replaces lists in values and merges maps (Helm SDK), so the chart's grouping and inhibit rules stay.repeat_interval: 5mre-sendsWatchdogevery 5 minutes. Alertmanager checks it after each group interval, 5 minutes in the chart, so keep it a multiple of that (configuration). Set the heartbeat service to alert when pings stop, as the Watchdog runbook describes.
PrometheusRule example
apiVersion: monitoring.coreos.com/v1
kind: PrometheusRule
metadata:
  name: my-app
  labels:
    release: monitoring
spec:
  groups:
    - name: my-app
      rules:
        - alert: MyAppHighErrorRate
          expr: |
            sum(rate(
              http_requests_total{
                job="my-app",
                code=~"5.."}[5m]))
            /
            sum(rate(
              http_requests_total{
                job="my-app"}[5m]))
            > 0.05
          for: 10m
          labels:
            severity: critical
          annotations:
            summary: High 5xx rate
This rule fires when over 5% of my-app requests fail with a 5xx code for 10 minutes. Both numbers are placeholders, so set them from your error budget. The rule assumes your app counts requests in http_requests_total with a code label. The counter in our Go guide has only method and path, so add code there first. The operator's admission webhook rejects rules with malformed expressions (README).
AlertmanagerConfig example
An AlertmanagerConfig lets a team keep its own routes and receivers in its own namespace. The chart's Alertmanager loads them from all namespaces, with no label filter (template). By default, the operator applies each one only to alerts whose namespace label matches the object's namespace (API reference):
apiVersion: monitoring.coreos.com/v1alpha1
kind: AlertmanagerConfig
metadata:
  name: shop-team
  namespace: shop
spec:
  route:
    receiver: shop-slack
  receivers:
    - name: shop-slack
      slackConfigs:
        - apiURL:
            name: shop-slack
            key: url
The shop-slack Secret in the shop namespace holds the webhook URL under the url key. Our monitoring guide covers severity levels and runbooks.
Grafana dashboards in kube-prometheus-stack
The chart sets up Grafana with a Prometheus data source and an Alertmanager data source (values.yaml).
Dashboards arrive as ConfigMaps labeled grafana_dashboard: "1". A sidecar in the Grafana pod watches ConfigMaps with that label and loads the files inside them (Grafana chart). The chart sets the sidecar to search all namespaces (values.yaml). To add your own, export the dashboard JSON from Grafana and store it the same way:
kubectl -n monitoring create \
  configmap my-app-dashboard \
  --from-file=my-app.json
kubectl -n monitoring label \
  configmap my-app-dashboard \
  grafana_dashboard=1
Use one ConfigMap per dashboard. The Grafana chart's README notes that several dashboards in one ConfigMap aren't mirrored properly.
Running kube-prometheus-stack in production
Upgrade kube-prometheus-stack and its CRDs
Helm installs a chart's CRDs only once. Its docs say "there is no support at this time for upgrading or deleting CRDs using Helm" (Helm docs). The chart's README says the same of its CRDs, and the chart bumps its major version whenever they change (README). So upgrade in three steps:
- Read UPGRADE.md for each major version you cross. For example, 92.x restarts Prometheus and Alertmanager once, and 90.x moved control-plane scraping to a token Secret.
- Apply the new chart's CRDs with server-side apply.
- Run
helm upgradewith the same chart.
helm pull \
  oci://ghcr.io/prometheus-community/charts/kube-prometheus-stack \
  --version 92.7.0 --untar
kubectl apply --server-side \
  --force-conflicts \
  -f kube-prometheus-stack/charts/crds/crds/
helm upgrade monitoring \
  ./kube-prometheus-stack \
  -n monitoring -f values.yaml
The CRDs are too large for client-side apply, which saves a copy in an annotation limited to 262,144 bytes (troubleshooting). --force-conflicts takes over fields that Helm set at install time. The chart's own CRD upgrade job does the same (values.yaml).
That job, crds.upgradeJob.enabled, runs the CRD step as a Helm hook. It has existed since chart 68.4.0 and is still a preview, off by default (UPGRADE.md, values.yaml). In Argo CD, sync the chart with ServerSideApply=true for the same size reason (README).
Control-plane targets down on EKS, GKE, AKS and kubeadm
By default, the chart scrapes kube-controller-manager, kube-scheduler, etcd and kube-proxy. It creates Services in kube-system that find their pods by labels such as component: kube-scheduler (service template). On EKS, GKE and AKS, the provider runs the controller manager, scheduler and etcd in a control plane it manages, apart from your nodes (EKS, GKE, AKS). So their Services find no pods. Like KubeAPIDown, the KubeSchedulerDown and KubeControllerManagerDown rules use absent(), so they fire when the component is missing from target discovery. Both fire as critical after 15 minutes (rule template).
On managed clusters, turn these scrapers off. Their alert rules go with them:
kubeControllerManager:
  enabled: false
kubeScheduler:
  enabled: false
kubeEtcd:
  enabled: false
kube-proxy is different. It runs on your nodes, not in the control plane (EKS). GKE Dataplane V2, the default for new Autopilot clusters, and AKS clusters with the Cilium data plane run no kube-proxy at all (GKE, AKS). There, also set kubeProxy.enabled: false, or the chart's KubeProxyDown fires as critical after 15 minutes.
Each provider exposes control-plane metrics its own way:
- EKS serves API server metrics at
/metrics. On Kubernetes 1.28 and later, it also serves scheduler and controller-manager metrics under themetrics.eks.amazonaws.comAPI group, which needsgetonkcm/metricsandksh/metrics(EKS docs). Add a scrape job for those paths if you want them. - GKE sends API server, scheduler and controller-manager metrics to Cloud Monitoring through Managed Service for Prometheus. You enable the package per cluster, and Google bills it per sample ingested (GKE docs).
- AKS gives free API server and etcd platform metrics. Its fuller control-plane metrics work only with Azure Monitor's managed Prometheus, and its FAQ says self-hosted Prometheus can't scrape them reliably (AKS docs).
On kubeadm clusters, the components run as pods, but kubeadm binds the controller manager and scheduler to 127.0.0.1 (manifests.go, L397). etcd serves its metrics on 127.0.0.1:2381 (local.go). Their targets stay down until you change bind-address and listen-metrics-urls. kube-proxy also binds its metrics to 127.0.0.1:10249 by default, and the README shows how to change its metricsBindAddress (README).
Prometheus retention, storage and persistent volumes
Plan disk with the formula from the Prometheus docs, which put the average at 1 to 2 bytes per sample (storage):
needed_disk_space =
  retention_time_seconds
  * ingested_samples_per_second
  * bytes_per_sample
Prometheus reports its own ingestion rate:
sum by (pod) (rate(
  prometheus_tsdb_head_samples_appended_total[1h]
))
Each replica writes to its own volume, so size one volume from one pod's rate. For example, 50,000 samples per second kept for 15 days at 2 bytes each needs about 130 GB. Size the volume so that retentionSize stays at or below 80 to 85% of it. The WAL and head chunks count toward that size, so the disk must also hold their peak, which comes every two hours (storage).
When the volume fills up, raising storageSpec isn't enough. The operator's docs note that Kubernetes doesn't yet support volume expansion through StatefulSets. Their manual fix pauses the Prometheus resource, patches each PVC, deletes the StatefulSet with --cascade=orphan, then unpauses (storage). The chart's KubePersistentVolumeFillingUp alert covers these volumes too.
Prometheus high availability
The Prometheus FAQ's answer to high availability is two or more identical servers (FAQ). With replicas: 2, both pods scrape the same targets and evaluate the same rules (high availability). The operator gives each a different prometheus_replica external label (API reference), and Alertmanager removes the duplicate alerts. Each replica keeps a full copy of the data, so you pay for the disk twice.
Queries need one more setting. Grafana's data source points at the chart's Prometheus Service, which spreads queries across both replicas without deduplicating them (README). Their samples are taken at slightly different times, so graphs can change between refreshes. The operator's docs suggest sticky sessions or Thanos Querier (high availability). For sticky sessions, set prometheus.service.sessionAffinity to ClientIP (values.yaml).
When one Prometheus can't handle all targets, shards splits them across several servers by target address. The chart marks sharding experimental, and querying across shards needs Thanos Query or remote write to one store (values.yaml).
Prometheus CPU and memory
The chart sets no requests or limits for Prometheus (values.yaml). Run it for a few days, then size them from what it uses. Watch prometheus_tsdb_head_series, the number of series held in memory, and the container's working set:
sum by (pod) (
  container_memory_working_set_bytes{
    namespace="monitoring",
    container="prometheus"}
)
Remote write adds memory too. The Prometheus docs say most users report about 25% more (remote write tuning). Our performance guide covers requests and limits. Our monitoring guide covers the sample limits that stop one target from flooding Prometheus.
If Prometheus runs out of disk or loses targets after upgrades, our Kubernetes consulting team starts with read-only access and a written list of what to fix first.
Prometheus long-term storage with remote_write
Prometheus's local storage is limited to a single node's scalability and durability (storage). For long retention or one view across clusters, Prometheus can send every sample to a remote store with remote_write. It keeps its local copy too (VictoriaMetrics). Failed sends are retried without data loss, unless the store stays down for more than two hours (remote write tuning).
| Store | Remote write path |
|---|---|
| VictoriaMetrics single-node | :8428/api/v1/write |
| VictoriaMetrics cluster, vminsert | :8480/insert/<tenant>/prometheus |
| Grafana Mimir | /api/v1/push |
| Thanos Receive | :19291/api/v1/receive |
Grafana's Prometheus data source also works with Mimir and Thanos, and VictoriaMetrics supports the same query API, so dashboards can read from the long-term store (Grafana docs, VictoriaMetrics).
This values entry sends samples to a single-node VictoriaMetrics at the address vm:
prometheus:
  prometheusSpec:
    remoteWrite:
      - url: http://vm:8428/api/v1/write
        writeRelabelConfigs:
          - action: labeldrop
            regex: prometheus_replica
The relabel rule drops the replica label, so both HA replicas send identical series. VictoriaMetrics deduplicates only once you set -dedup.minScrapeInterval, and only samples with identical labels. It then keeps one sample per series in each window, and its docs recommend setting the flag to your scrape interval (deduplication). The operator's default scrape interval is 30 seconds (API reference). Mimir deduplicates HA pairs by a cluster label and a __replica__ label instead. For Mimir, keep the replica label and set replicaExternalLabelName: __replica__ (troubleshooting).
Managed stores accept remote write too. AWS documents remote write with SigV4 signing to Amazon Managed Service for Prometheus (AWS docs), and the operator's remoteWrite has a sigv4 field. Grafana documents remote write from kube-prometheus-stack to Grafana Cloud (Grafana docs). Our monitoring guide compares managed Prometheus pricing.
Watch the pipeline itself. The chart's default rules include PrometheusRemoteWriteBehind and PrometheusRemoteStorageFailures (rules). The prometheus_remote_storage_samples_pending metric shows how many samples wait to be sent (remote write tuning).
Thanos sidecar with kube-prometheus-stack
Instead of remote write, the Thanos sidecar uploads Prometheus's two-hour blocks to object storage, and Thanos Query reads across replicas without duplicates (README). Thanos still recommends a persistent disk for Prometheus, because a crash loses about two hours of data (sidecar). The chart configures the sidecar under prometheus.prometheusSpec.thanos, which its values file marks experimental (values.yaml).
Prometheus agent mode
If Prometheus only forwards data, run it in agent mode. It keeps scraping and remote write and drops local queries, rules and alerting, so alerts must run in the remote store (agent mode). The operator runs it from the PrometheusAgent resource, still v1alpha1, and the chart switches to it with prometheus.agentMode: true (values.yaml).
How we run Prometheus on Kubernetes
In the clusters we run, Prometheus, run by the Prometheus Operator, collects metrics, and VictoriaMetrics stores them. We moved storage from Prometheus to VictoriaMetrics because Prometheus on its own has no clustering or built-in high availability. We keep metrics for two years. In all, we have about 6 million time series and about 7 trillion stored data points.
We track metric volume as inserts per minute and review it every week. Our monitoring guide tells the story of one jump that this review caught.
For a new cluster, we would start from the VictoriaMetrics operator. It converts ServiceMonitors, PodMonitors, PrometheusRules, Probes and ScrapeConfigs into its own objects, so the resources in this guide carry over (VictoriaMetrics operator). We use no paid monitoring service.
We have run production systems since 2009 and have managed more than 1,350 production servers. If you'd rather not run Prometheus alone, our Kubernetes consulting team starts with read-only access and a written list of what to fix first. We can also run your clusters afterwards. On-call is by agreement, with up to 24-hour coverage under an SLA, and post-incident reviews are part of on-call work.
Frequently Asked Questions
What is the difference between Prometheus and Grafana?
Prometheus collects metrics, stores them as time series and evaluates alert rules. Grafana draws dashboards from data sources such as Prometheus, and its Prometheus data source comes preinstalled (Grafana docs). The Prometheus FAQ recommends Grafana for production dashboards (FAQ). kube-prometheus-stack installs both and connects them, so you can use Grafana from the first login.
Is Prometheus part of the Grafana stack?
No. Prometheus is an independent open-source project, maintained by no single company, and it joined the CNCF in 2016 (overview). Grafana Labs builds tools that work with it. Grafana ships a Prometheus data source, and Grafana Mimir provides long-term storage for Prometheus metrics (Grafana docs, Mimir). kube-prometheus-stack installs Prometheus and Grafana together.
What is the difference between Node Exporter and Prometheus?
Node exporter is a small agent that exposes a host's hardware and operating system metrics over HTTP, on port 9100 by default (node_exporter). Prometheus is the server that scrapes those endpoints, stores the samples and runs alert rules. kube-prometheus-stack runs node exporter as a DaemonSet, one pod per node, and its Prometheus scrapes every pod.
Is Prometheus used for metrics?
Yes. Prometheus collects and stores metrics as time series, numbers recorded with a timestamp and optional labels (overview). It isn't a log store. Its FAQ says not to feed logs into Prometheus and points to Grafana Loki or OpenSearch instead (FAQ). Our monitoring guide covers logs and traces.
What is the default Grafana password in kube-prometheus-stack?
There is no fixed default. The Grafana subchart generates a random 40-character password for the admin user. It stores it in a Secret named after the release, such as monitoring-grafana for a release called monitoring. Read the admin-password key with kubectl get secret and decode it with base64 --decode. To set your own, point grafana.admin.existingSecret at your Secret.
Related Reading
Related posts
Kubernetes on Bare Metal: On-Prem Setup and Day 2
How to run Kubernetes on bare metal and on-premise in 2026: provisioning, distributions, HA, load balancing, storage, upgrades, costs and our on-prem work.
Kubernetes Monitoring: Tools, Metrics and Alerting
How to monitor Kubernetes in 2026: what to watch, where each metric comes from, monitoring and observability tools, alerts, costs, and the stack we run.
Kubernetes CrashLoopBackOff: Causes and Fixes
What CrashLoopBackOff and "Back-off restarting failed container" mean in Kubernetes 1.37, how long the backoff lasts, and how to debug and fix the cause.